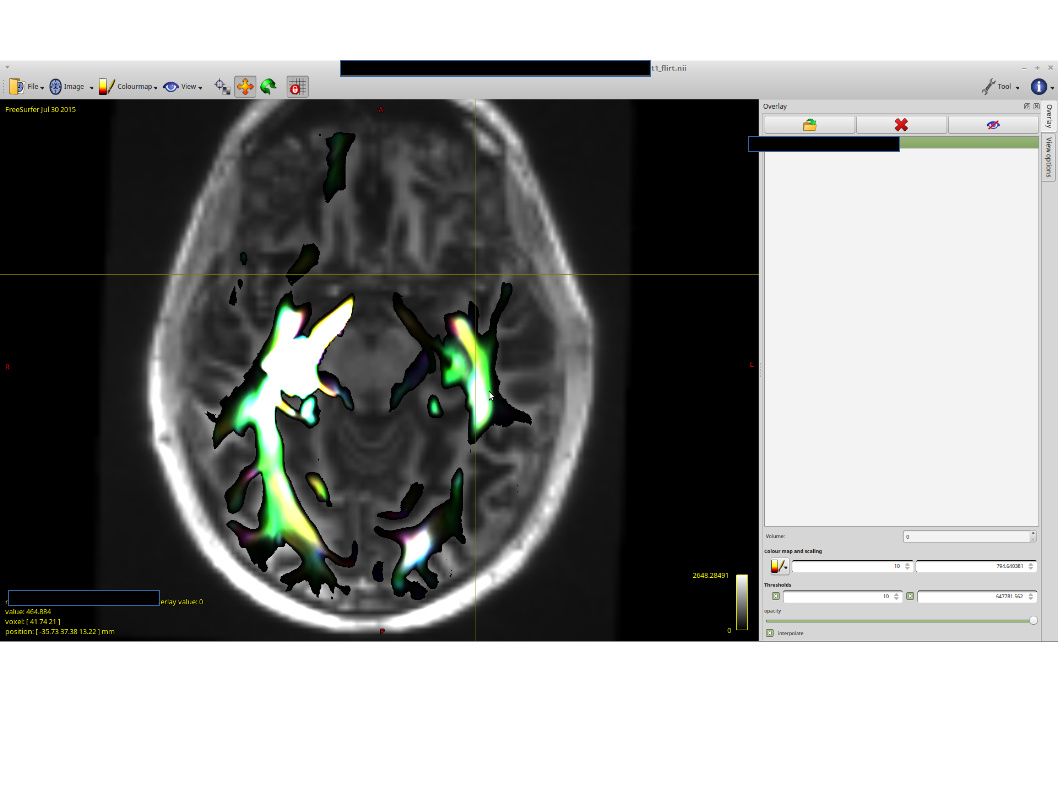
I have created a tractogragram of 50 million streamlines based on an ROI seed, and I then ran tckmap to super-resolve the data at 500 microns. The output is very nice, but there are some regions where there are bright hotspots (see the picture below). I have carried out various mrcalc commands on the .mif output (e.g. log, log10, sqrt) in an attempt to make the intensities more linear, but the bright spots still appear. I have played with the various threshold and intensity settings but to no avail.
Could you please offer some advice on how to address this? Also, could you please clarify the differences between the ‘colour map and scalings’, thresholds, and the scales under View Options (in rendered mode) i.e intensity scaling, transparency, thresholds, and alpha?
Localised TDI hotspots like that are standard fare for basic whole-brain tractography: There will tend to be a greater number of streamlines in deep WM away from other tissues, where the pathways are “easiest” to track, and also in the longest pathways if seeding throughout WM. This is precisely the kind of reconstruction bias that methods such as SIFT and SIFT2 are aimed at alleviating, so I would suggest reading those papers (as well as the COMMIT and LiFE methods if you’re interested in the concept).
Also, could you please clarify the differences between the ‘colour map and scalings’, thresholds, and the scales under View Options (in rendered mode) i.e intensity scaling, transparency, thresholds, and alpha?
Not 100% on exactly where the ambiguity is coming from, but I’ll give it my best shot:
“Colour map and scalings”, if you’re referring to the matching entry in the Overlay tool, specifically applies to any selected images within the Overlay tool. So changes made there will not affect the “primary” image opened in mrview; only images being overlaid on top.
Since you mentioned “Thresholds” twice, I presume in the first instance you were referring to the corresponding entry also in the Overlay tool? Again, this applies only to selected images within the Overlay tool, and will not influence the main image.
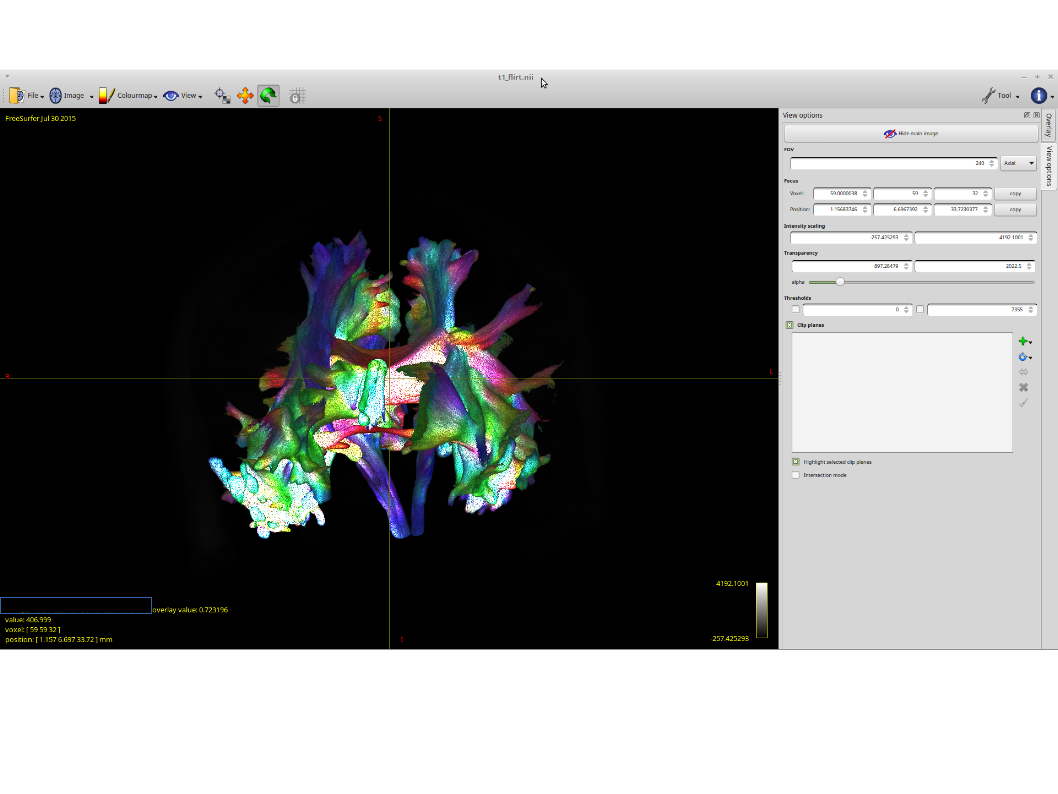
In the “View Options” tool, if you are in anything other than volume render mode, only “intensity scaling” appears, which controls the image values that correspond to the extremities of the colour map. However this applies to the main / primary image only.
If in Volume Render mode, then transparency / thresholds / alpha also appear in the View Options tool. These relate to the mechanism by which the volume render operates. One can think of each pixel on the screen as a “ray” passing through the 3D image volume, starting from the screen camera location, and sampling the underlying volume at some regular step size along that ray. These parameters then affect which samples are discarded entirely, how different image intensities contribute to the value for that particular pixel, and how deep into the volume the ray can pass before the value becomes saturated. These controls apply to the main image only.