Hello,
I am new to using MRtrix and I was hoping to get some feedback about the results I have. I followed the instructions to perform fixel-based analysis using single tissue CSD. The data I’m using is b=3000 s/mm2 with 60 directions.
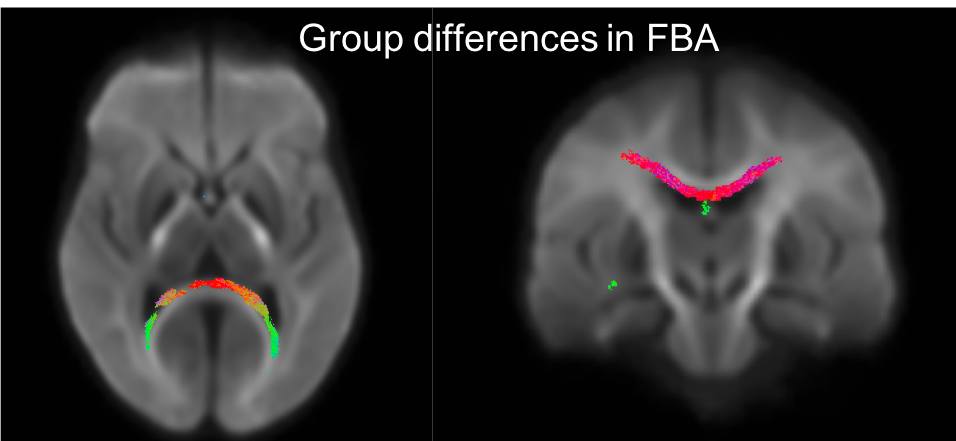
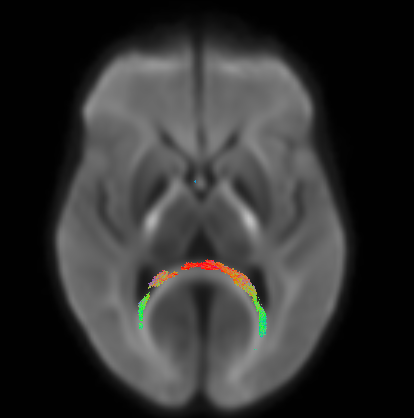
Below is a figure of the fixels that show p<0.05 when looking for group differences between the two groups I have. It looks like the forceps major but also looks like it could be in the ventricles. The groups have difference in ventricle size so this is a bit unsettling. With the high b value there should be little signal from the CSF, so I’m not sure if the differences in the ventricles would be causing this? Would using multiple tissue CSD and fitting models to only WM and CSF help in this case? Any thoughts would be greatly appreciated. Thank you!!
Best wishes,
Jane
Yes, I can see why that might be a concern. The fact that the significant fixels appear to extend into the ventricles isn’t necessarily a concern, as long as the voxels concerned do contain a non-negligible partial volume of WM. With your high b-value, the CSF signal will indeed be close to completely suppressed, so the signal from those voxels would be dominated by the WM contribution – and as long as there’s enough signal to give you a supra-threshold fixel, it will be included in the analysis.
But ruling out a difference due to imperfect registration is a trickier one. For that, I think your best bet might be to generate an average ODF map for each group, and compare them visually. If you see a clear difference in the extent of the ventricles in this region, that would definitely suggest that there might indeed be a problem with registration. But given what you’re showing, it would take quite a big mismatch to result in such an extensive difference…
I don’t think it would make an enormous amount of difference, but that will depend to some extent on your data, how bad the differences are in ventricular size, how noisy the images are, etc. If you find that noise is an issue, this might be improved with MSMT-CSD. But I wouldn’t automatically assume it would make a great deal of difference… But first, your best bet is to generate these averages ODF templates for the two groups separately and see whether there is indeed a difference at that level.
1 Like
Dear Dr. Tournier,
Thank you very much for your reply! It really cleared things up for me. I’ll have a go at it.
Best wishes,
Jane
Dear Dr. Tournier and MRtrix experts,
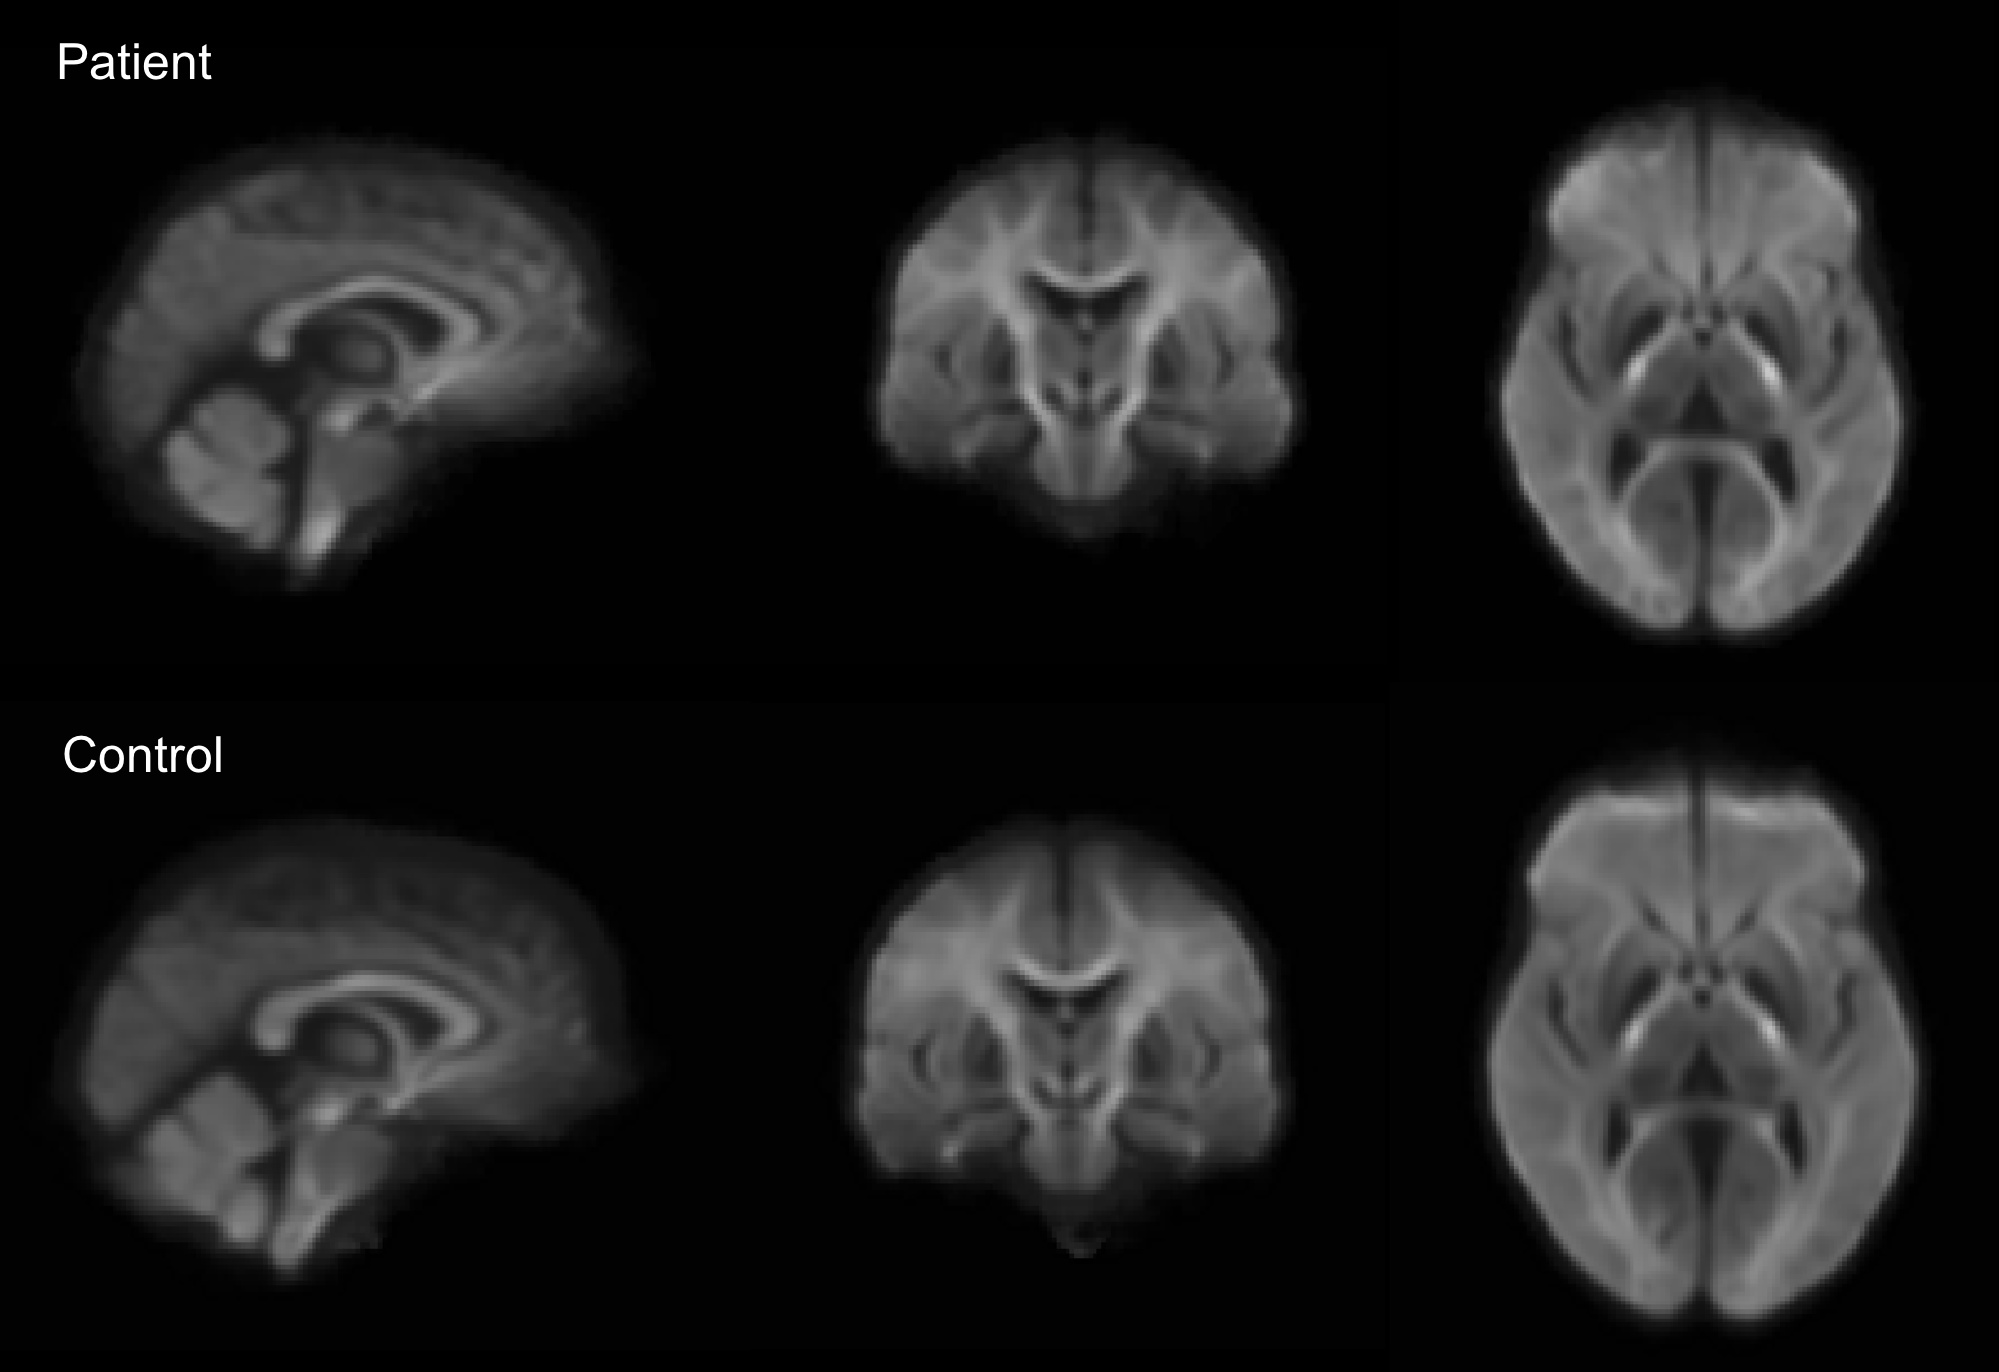
As suggested, I have generated ODF templates for each group. I can visually see a difference in the ventricles but am not sure if this is big enough to be causing the groups differences in my FBA results.
I was also wondering in the case where there are anatomical brain differences between groups, is the only way around this issue to extract measures of interest from native space? When using a template-based analysis, we would only be able to safely trust results that do not overlap with regions where there are anatomical differences?
Any thoughts are greatly appreciated. Thank you!
Best wishes,
Jane
I agree it does look like the difference in ventricle size may be driving a lot of these changes… I can’t really think of a way around this, other than a step change in the registration algorithm itself – which is no trivial thing. However, I note that your changes seem to extend beyond the regions adjoining the ventricles: in these regions, there’s a good chance that the differences are genuine. You’d need to be careful though, since significance is based on fixel enhancement, which means that the changes in regions away from the ventricles will receive a statistical boost from the problematic regions. So it’s still not a simple as you might like…
3 Likes
Yes, I see. Thank you again for your valuable comments!!