Hi experts, I have been messing around with tcksample and tckedit trying to recreate the cropped & coloured tractogram results as shown in this figure:
I can’t seem to get the cfe results into a format that can communicate with the tractograms in a way that produces anything like 4d or 4f. Could someone explain the exact sequence of commands that would get me from 4a through 4f as shown in the figure? Thanks so much in advance!
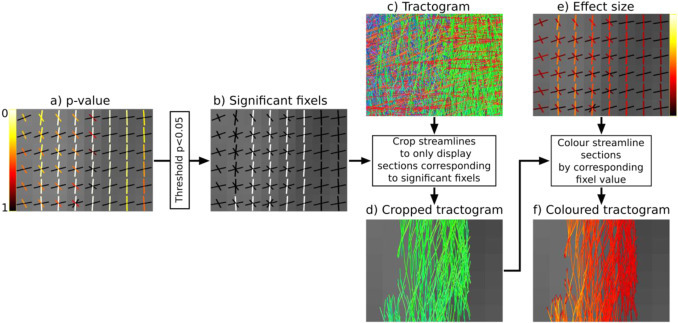
Hi Rachel,
Assuming you are using the default master code branch on Github.
Use tckedit to reduce the whole-brain template tractogram to a sensible number of streamlines (2 million is too much for basic graphics cards to handle).
Visualise track scalar files using the tractogram tool in MRview. First load the streamlines (tracks_200k_sift.tck). Then right click and select ‘colour by (track) scalar file’. For example you might load the abs_effect_size.tsf file. Then to dynamically threshold (remove) streamline point by p-value select the “Thresholds” dropdown and select “Separate Scalar file”.
Note that you can also threshold and view all brain fixels by deselecting “crop to slice” in the vector plot tool. However it can be harder to appreciate the specific pathways affected. The downside to viewing and colouring results by streamline, then viewing all streamlines (uncropped to slice), is that without transparency you only see the colours on the outside of the significant pathways, where normally the effect size/pvalue is most sever in the ‘core’ of the pathway.
If you want to visualise the effect size with respect to the control mean, then you can divide the effect size fixel file by the appropriate beta file output from fixelcfestats (using fixelcalc). Note that when computing this with the files output from analysing log(FC), its a little more complex. I’ll add a tutorial on this soon.
The commands to do all of the above will slightly change with the up coming release. However, I will put the new instructions in the MRtrix documentation.
Cheers,
Dave
There isn’t any secret sauce recipe required; it’s just a matter of knowing exactly what quantity you are trying to derive, and appreciating that the values provided to fixelcfestats were not FC but the log transform of such.