Strange fiber structure for HCP data

Hi Community,
I obtained some results about connection of ROIs (FFA), but I have two doubts: Fig.1(as following) Fiber count of ROIs (FFA) connection is very little. Is this normal? Fig.2(as following) Fiber structure is strange. How can I eliminate such fiber? Generating the fiber with parameters as following:

tckgen WM_FODs.mif 1M.tck -act 5TT.mif -backtrack -crop_at_gmwmi -seed_dynamic WM_FODs.mif -maxlength 250 -select 1M -cutoff 0.06
Fig.1

Fig.2

Any suggestions there?
Thanks,
Jian

Hi @jiangjiane
I agreed with you. The green parts of the fibres look too winding. Did you use too small curvature radius? Maybe, Donald could give some comments on this.@jdtournier
Best,
Zonglei

Hi @Zonglei,
Thank you for reminding me!
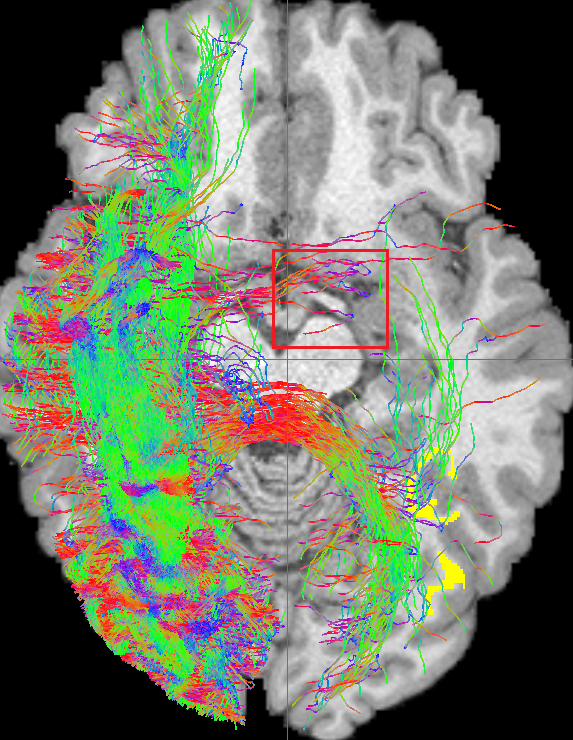
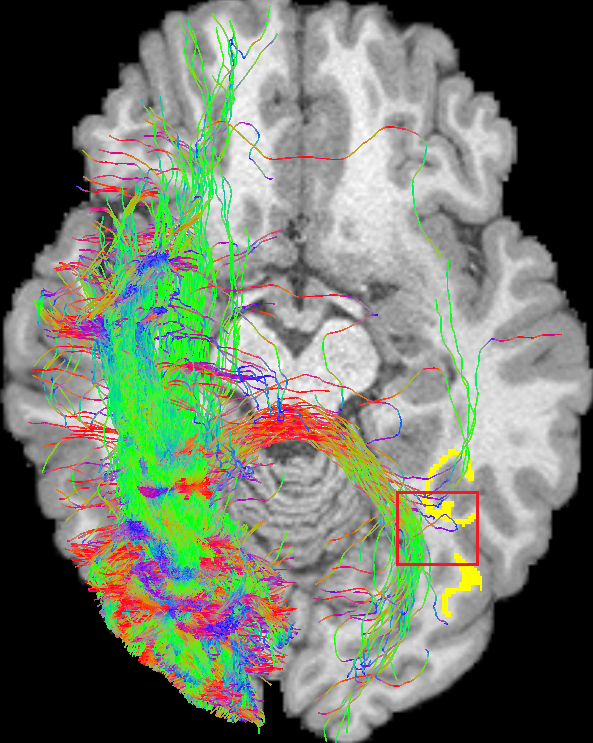
Yup, maybe the curvature radius is too small ever before, but the phenomenon still exists after I changed the angle from 45° (R=0.866mm) to 36° (R=1mm), even 24° (R=1.5mm):

-angle 36

-angle 24

I am very confused and hope to get the answer!
Jian

I’m a bit confused as to what the problem is exactly (?). It’s very hard to tell from a whole-brain projection onto a single slice whether the stray connections that you’re referring to are sensible or not (I assume this is showing all the streamlines with ‘crop to slab’ ticked off?). Some of the fibres you’re highlighting look like they could sensibly relate to anterior commissure, the other to the superior longitudinal fasciculus / arcuate fasciculus - neither of which are anywhere near the slice you’re showing. Likewise, the streamlines clearly cross the midline through the splenium of the corpus callosum, which is some distance above the slice you’re showing (currently it ‘looks’ like they’re crossing over the top of the brainstem). Those highlighted in your original post are harder to figure out, but again, it’s impossible to assess from a projection like this, these are 3D structures and there’s a good chance the streamlines still take sensible enough paths when looking at them at the appropriate anatomical slice location. They look like they do a U-turn in your single-slice projection, but that could easily be an artefact of the projection onto a 2D slice, rather than a genuine U-turn. I recommend you switch back to ‘crop to slab’ and follow these streamlines through the anatomy to verify whether they are sensible or not.

The other issue raised is that the fibres ‘look too winding’. I’m guessing this refers to their somewhat ‘wiggly’ nature? This is to be expected with probabilistic tractography: it’s designed to sample the range of possible connections, taking all sources of uncertainty into account. If you’re used to looking at the output of deterministic algorithms, this will of course look ‘messier’ than you’re used to, but in my opinion it’s much safer to obtain the full range of likely connections than just the most likely connection. In a probabilistic setting, you shouldn’t be looking at an individual streamline too closely, that’s a single random sample from the full distribution of possible streamlines. It’s the bulk of them that matters.

As to why you have a low count for the FFA, I can’t really answer that, I’ve no experience with this area and its connectivity. Do you expect to see homotopic projections between the contralateral FFA regions? I have to say, given where these ROIs seem to be located, this is not a projection I’ve noticed in the past… But others may be better placed to comment on this.

1 Like

Hi @jdtournier
Thank you very much for your suggestions on how to reasonably verify the streamlines.

As you said, we shouldn’t look too closely at an individual streamline from the probabilistic tractography because they are expected to be wiggly. Does that mean if we aim to study the shape of the streamlines, we had better not use the probabilistic tractography.

Yes, we expect to see homotopic projections between the contralateral FFA, but we still don’t know if the hypothesis is right. Did you know some studies which investigate the inter-hemispherical connections for occipital or temporal regions?

Look forward to hearing your comments.

Best,
Zonglei

Not so much because they’re wiggly, but because an individual streamline with unexpected (large-scale) trajectory can come up in probabilistic algorithms, even when it is low-probability. If a similar trajectory comes up often, then it lends support to this pathway being due to more than a random freak occurrence. The ‘wiggly’ nature is a short-length local effect, this is not what I’m talking about.

No, it just means you shouldn’t look at the short-range aspects of these streamlines (the wiggly-ness will be similar for all streamlines, and that means curvature & torsion will be similar too). It should be OK if you focus on long-range overall shape. Also, if you do want to look into shapes, clearly looking at individual streamlines is problematic if any one streamline might be a spurious random trajectory. You’d need to at least filter out the subset of streamlines you’re interested in, and somehow average them or extract parameters representative of the set - using measures such as the Haussdorf distance, for example (se e.g. this early abstract from @rsmith).

Sorry, I’ve no idea about these regions. All I can say is that I rarely observe trans-callosal connections that extend this far down in the occipital lobe. As far as I can tell, that would require crossing through the optic radiations / inferior longitudinal fasciculus, which I don’t see much evidence for. But don’t take my word for it, I haven’t looked into this in any detail whatsoever…

1 Like

… and somehow average them or extract parameters representative of the set - using measures such as the Haussdorf distance …

This isn’t about the Hausdorff distance so much as having the capacity to estimate a single “exemplar” streamline trajectory from a set of streamlines. This is probably along the lines of what @Zonglei is looking for: a central exemplar trajectory won’t have the probabilistic “wiggle” since it all cancels itself out across streamlines, so shape analysis should be more robust.

Unfortunately there’s no method currently built into MRtrix3 to do this. It’s something I’ve played with in the past and may well be handy to have though…

1 Like

@rsmith,
I thought that this can be achieved using -exemplar option in connectome2tck as instructed here:
http://mrtrix.readthedocs.io/en/latest/quantitative_structural_connectivity/connectome_tool.html#visualising-edges-as-streamlines-streamtubes
Or am I wrong?

1 Like

I thought that this can be achieved using -exemplar option in connectome2tck

Yes it can; but this is strictly available in connectome2tck only. It’s a better-posed problem in this case since there’s intrinsically a limitation on the extent to which individual streamlines can deviate from the “mean” path (though outliers / genuine branching are certainly possible), differences in streamlines lengths are minimized, and detection of which streamlines are reversed with respect to others is more easily detected based on the connectome parcel assignments. (There’s also a fairly naive heuristic in there to get each exemplar to converge toward the centre of mass of each parcel, though that’s maybe too tangential a story)

For an arbitrary input set of streamlines, generating the mean exemplar trajectory is a deceptively difficult problem. Indeed just detecting which streamlines are in the “correct” order, and which need to be reversed, is non-trivial: various heuristics may be devised, but each inevitably breaks down in particular scenarios. In some cases with dispersing streamlines trajectories, you’d likely even get a lot of inter-rater discrepancy regarding where the “mean” trajectory should go. I’ve been hesitant to include anything in MRtrix3 for the case of arbitrary input track files because I suspect people would break / be unhappy with even my best algorithm without too much difficulty.

2 Likes