Looks like your spreadsheet software didn’t parse it well: you can still see each row on a separate… row. And each separate number per row is a separate entry (“column”). I’m not sure what software you’re using here, but you may be able to tell it what separators separate elements and rows, and get it imported correctly.
Hi,Michiko,
As shown in your .csv file. Does it mean the self-connections(output streamlines that connect to the same node at both ends.) are much more than that connection between the region to regions.
I suspect it is correct? as I guess left Corpus callosum may have a strong connection with right Corpus Callosum.
Thanks,
Chaoqing
Not to open the new topic.
Is it possible for the tck2connectome output to be in form of this:
for example.
#hemisphere | parcelation | hemisphere | parcelation | connection_type | connection_score
r InfFGOrp l PosCS 1 0.0229917613607071
The data information is all there, parcelation is used according to freesurfers LUT.
Or, is there anyway to convert it myself?
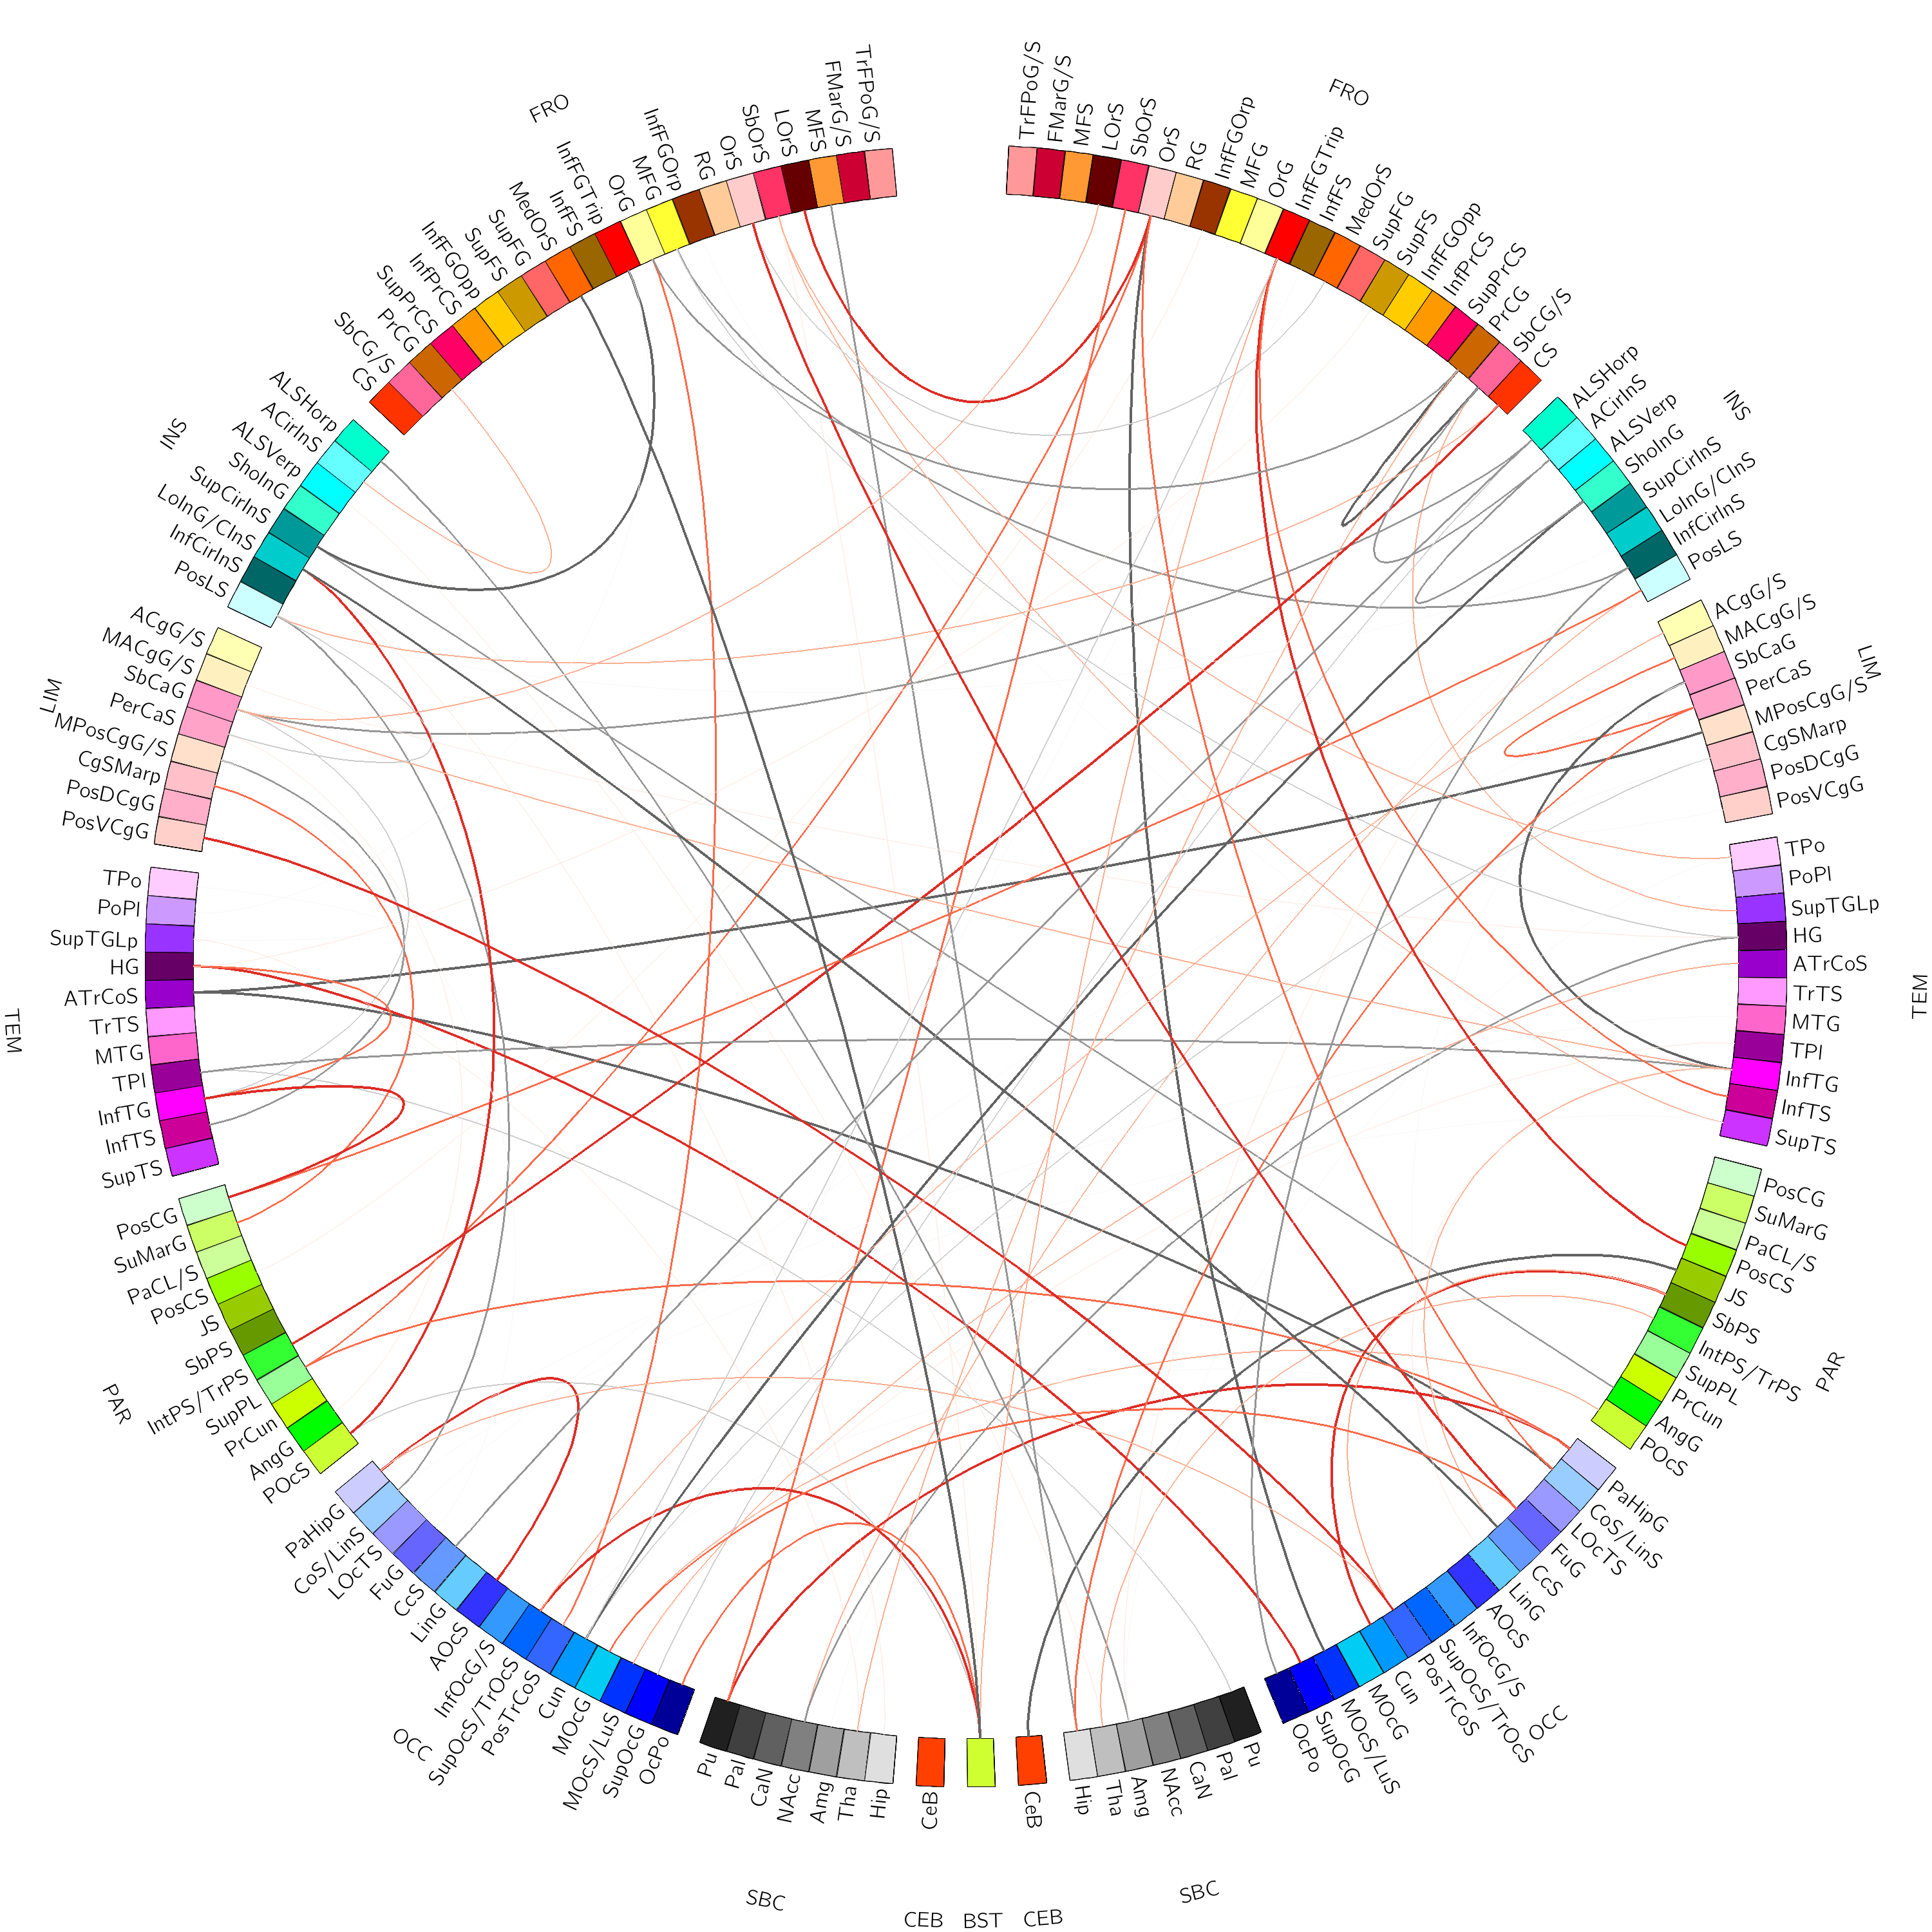
In this case we can construct these popular connectograms with circos:
for example
Hi @david142,
I would try using this network visualization package http://immersive.erc.monash.edu.au/neuromarvl/
It’s a lot easier (relative to circos) to get the necessary connectomic inputs into the software. Moreover, it nicely details the hierarchical distribution of connections, which can be lost with circos…
Mind you, the connectomes extracted from tck2connectome are asymmetric - meaning you may need to symmetrize them for their use in neuromarvl.
Best,
Alistair
1 Like
Not to open the new topic.
Nothing wrong with opening new topics; if anything it’s preferable ![]() You can always provide a link to another topic if you think it might be relevant.
You can always provide a link to another topic if you think it might be relevant.
Is it possible for the
tck2connectomeoutput to be in form of this
Not directly. It could however be achieved with some fairly minimal scripting involving the connectome LUT and matrix data.
Mind you, the connectomes extracted from
tck2connectomeare asymmetric - meaning you may need to symmetrize them for their use in neuromarvl.
Neurotic clarification; tck2connectome by default produces symmetric matrices, but stored in upper triangular format. “Asymmetric” generally refers to when the reflected values are not identical but also not simply zero-filled; i.e. the connectivity from A to B is not identical to the connectivity from B to A.
You can also output symmetric matrices from tck2connectome using the -symmetric option.
Rob
Hi Alistair,
thank you for providing this good online package, but I was wondering how could I get the node attributes, such as strength, cluster, betweenness and the like. Do you get these attributes from matrix or other tool-package?
Thank you,
Ziqian Wang
Hi @1111 (Ziqian),
No problem at all.
This is a bit of a complex and open-ended question, as you will need some some form of experience with graph-theory metrics and analysis. A good start will be the brain connectivity toolbox in Matlab and it’s seminal technical paper.
For the spatial representation of the node coordinates (and inter-node connections), you will need to extract each parcels centre of gravity (or rather their centre of mass). Bear in mind that the parcellation file used in connectome construction with tck2connectome is more than likely in individual subject-space, and will not align with the standard meshes used in the visualisation packages. You will need to extract the coordinates from the parcellation file in standard space (i.e. MNI).
Another consideration is the resultant connectome matrices are unthresholded causing the interpretation of connectomes difficult and perhaps computationally expensive.
p.s. @rsmith, @jdtournier - perhaps we should add a wiki page for network vis options?
Best,
Alistair
1 Like
Hi @Alistair_Perry,
thank you for your useful reply. I’ll try brain connectivity toolbox first.
And about the coordinates. Indeed,tck2connectome is in individual subject-space. So I extract the coordinates of node in individual space by the command:
for i in {1…84}; do mrcalcnodes.mif $i -eq - -quiet | mrcentre - scanner; done
Do you mean I normalize it first and then extract the coordinates or just use the default coordinates in the file?
Best,
Ziqian Wang
Hi Ziqian,
Two options:
-
Yes, use the default coordinates.
-
Normalize the individual (an exemplar) parcellation by registration into standard space, then run the above command.
Also try BrainNet Viewer in matlab for another network visualisation option.
Best,
Alistair
Hi there,
I’m new at mrtrix and that’s really helpful. Thank you.
I was wondering if this interpretation is still valid under sift2. I mean that would the interpretation when weighting the streamlines by the output of tcksift2?
Thank you.
Hassna
From the topic of “Dense connectomes from CSD-ACT-SIFT”: “For the second algorithm, just about any trajectory through the white matter is possible. So at some point after an adequate number of streamlines have been generated, there will be at least one streamline connecting every single possible pair of nodes, and the network density will be 100%.”
Dear MRtrix team,
I want to calculate the shortest path length between one given pair of nodes. Before doing this, I thought I had to threshold the matrix (connectomes.csv) from CSD-ACT-SIFT(10M) and tck2connectome without -scale_* options to assign each value of the elements less than proposed threshold to 0 and to leave each value of the elements not less than proposed threshold intact; that is to say, when the number of streamlines (NOS) connecting one given pair of nodes reached how much, there would be a structural connection between them.
Could you help me figure out how to choose the threshold value or why I thought it wrong? Thanks very much!
All the best,
Hui Zhang
Hi @hassna,
It’s not clear exactly to which detail your question is directed; but in general, the interpretation of connection density under the SIFT model is consistent with modulating streamline contributions by the weights calculated by SIFT2. Indeed the original SIFT algorithm can be thought of as a special case of the SIFT2 concept, where the majority of streamlines are given a weight of 0 and those retained streamlines are given some fixed weight >> 1.0.
Rob
Hi Hui,
I want to calculate the shortest path length between one given pair of nodes.
I am assuming here that you are talking about the graph theory definition of “shortest path length”, as opposed to the shortest streamline length connecting two regions.
Before doing this, I thought I had to threshold the matrix …
If you have to threshold a streamlines-based connectivity matrix, be very sceptical about the analysis you’re doing. The connection densities in such matrices vary by many orders of magnitude. This also happens to be the range of densities observed in quantitative tracer studies; not that the latter is evidence of the accuracy of the former, but it certainly brings to question any process that is based around such a distribution being erroneous. If you have some edges with weight 1 and some with weight 100,000, and your analysis result changes depending on whether or not you threshold the edge with weight 1 to weight 0, your problem is your analysis method, not your data / threshold.
Over and above that, any graph theory analysis that depends on a quantification of “length” is difficult in the context of weighted connectomes. In a binary connectome, it’s easy: Count the links. For weighted connectomes, you need to define some transformation from “strength” to “length”. Most commonly it is simply the reciprocal that is taken; but this is not a unique answer, and the transformation chosen will very much influence the raw results and the higher-order empirical behaviour of the quantification. So I would advise thinking more carefully about exactly what you’re trying to quantify / achieve rather than focusing on what threshold to use.
Cheers
Rob
Rob, I have known that and need to rethink my way. Thank you so much!
Hi @rsmith, for you which is the best metric option to use ? -scale_invlength ?
Thanks in advance,
G.C.
which is the best metric option to use ?
-scale_invlength?
![]()
https://www.sciencedirect.com/science/article/pii/S1053811916301677
Rob
1 Like
Dear Rob,
I’d follow with this topic, regarding edge weight distribution of a structural connectome derived with SIFT2 weighted streamline counts. You kind of explained that such high density, fat tailed distribution is normal and consistent with tract-tracing data. My question is, would it nonetheless problematic for parametric statistical testing across groups? Or in another word, is it a good practice, to firstly logarithm transfer the matrix, so that its edge weights are normally distributed? My purpose is to compare subsequently derived graph theory measures across groups.
Welcome Xiaosong!
The way you phrase your question slightly conflates a couple of different things, so I’ll try to break them up here.
-
Taking logarithm of edge weights
While I’ve not yet come across the opportunity to publish such anywhere, in the specific case of performing edge-wise statistical tests, I would indeed advocate taking the logarithms of edge weights prior to applying the GLM. As evidenced indirectly in my SIFT follow-up manuscript (Figure 4 scatterplots) and reported more directly in a 2016 ISMRM abstract, the noise within connectivity estimates of individual bundles is much closer to multiplicative than additive, and therefore log-transforming such data prior to fitting a linear model may be beneficial.
-
Computation of graph theory measures
If however you wish to compare the outcomes of calculating global network measures across subjects, then it is normality of the graph theory measures that is desired for the fitting of a linear model. Exactly what distribution those measures take I don’t know.
But guaranteeing normality of the underlying edge weights will likely not guarantee normality of the resulting graph theory metrics.
I would instead think about what those metrics are actually doing, and therefore what data they should be provided with. E.g. Imagine that you are an IT network administrator, and you’re trying to characterize the connectivity of a computer network. There’s a 100Gb/s backbone connection across sites, 10Gb/s switching hardware at each site, 1Gb/s network connections to individual systems, and an old 25-pin connector going to a printer from 1980. In calculating properties of the network, do you use the connection bandwidths, or their logarithm? It’s basically the same question; and the consequences of such a transformation will likely vary across the various measures.
While I wouldn’t say that to me personally use of the raw connection densities themselves makes more intuitive sense, it’s entirely possible that the response of those measures to perturbations of the connection densities (i.e. noise) is better-behaved if they are first log-transformed. But firstly that’s a dedicated experiment in its own right, and secondly it’s important to appreciate the consequences of such a decision. E.g. You’re no longer calculating the small-worldness of the network, but the small-worldness of the log-transformed network.
Plenty of food for thought here 
Rob
2 Likes
Dear Rob,
Thank you so much for such an insightful discussion! I have to say it is quite tempting to perform the log-transforming, especially when I am working on graph theory measures such as strength. As you may expect, the strength distribution is fat-tailed when calculated from the original SIFT2 matrix, and became normally distributed when calculated from the log-transformed SIFT2 matrix (I tested and yes it’s true). I do have a few other novel measures but I observed similar behaviors as well.
The tricky thing is, I do not have a strong justification other than such statistical benefit, and a potential noise control benefit. Unfortunately, as you indicated, the latter has not been fully tested, not to mention its unknown impacts on subsequent scientific conclusions. I guess essentially, it’s a question that whether such a log-transformed streamline count/SIFT2 network can represent the brain structural connectome or not. To support such a notion one could argue that in the past people use FA, MD, QA, etc to weigh the connectome matrix and those matrices are distributed normally. But indeed, unfortunately, I do not have a precedent to follow. I am sure since the distribution has changed, it will inevitably change the patterns of some if not all those graph theory measures. But that also applies when people choose to use FA when they could have used streamline counts. I understand we still have not reach a consensus in the diffusion world, but how such discrepancy was dealt in the past? Can we refer to those experiences to justify the usage of a log-transformed streamline/SIFT2 matrix to represent the brain structural connectome?
Thanks again for such an interesting conversation!
Best,
Xiaosong
Hi,
I know its been over three years since you posted your question and thoughts, however I was wondering how you dealt with this problem in the end?
I am currently looking for the “correct” way to do edge-wise permutation-testing with my diffusion data and came across the term “log-transforming” a couple of times. Did you do log-transform your data in the end? If yes, how did you defend your choice?
Thanks in advance!