Thank you for providing the advanced tools.
I am going to do fiber tracking on optic chiasm dataset.
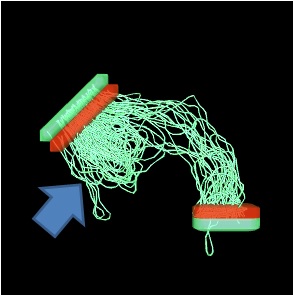
My goal is to detect fibers that hit or pass through both green ROIs.
In order to do that, I specified 2 Seeding_regions (red color) and selected the following parametes:
mrtrix tckgen FOD.nii fibers.trk -seed_random_per_voxel Seeding_regions.nii 40 -include ROIs.nii -mask mask.nii -stop -seed_unidirectional
I am wondering why there are more density of fibers on the left side (indicated by blue arrow).
I am deeply grateful if you could tell me that whether the adjusted parameters are reasonable or I should modify them.
The best understanding of what’s going on here comes on knowing what the code is actually doing:
Draw a seed that is inside the seed ROI.
Generate a track of sufficient length.
Does the track traverse all of the mask images provided via -include?
Now consider the case where a seed point is drawn in the red area top-left, does a 180-degree turn, and traverses the green area top-left. This satisfies all three steps.
This misconception has popped up more than once I think, though I can’t find an example thread easily to link to… When you provide to MRtrix3 a ROI image that contains two distinct blobs, MRtrix3 simply does not care that there are two distinct blobs; all it tests for here is that the seed point is within a red voxel, and the streamline traverses at least one green voxel along its length. The green -include ROI is therefore effectively performing an “or” operation: a streamline only needs to traverse one of the two green blobs in order to satisfy all criteria.
Reconstruction of a pathway like this would more typically be performed as follows:
Generate track file 1 using the top-left green region as the seed region and the bottom-right green region as the -include region.
Generate track file 2 using the bottom-right green region as the seed region and the top-left green region as the -include region.
Thank you for your comprehensive explanation.
I am just wondering about the necessity of generation of 2 files in two directions?
Why is not 1 file enough ?
It’s not strictly necessary, but is certainly somewhat of a convention in the field. There’s no a priori justification for using one end of the pathway as the seed and the other as the target, so doing both directions is in fact imposing fewer assumptions. Also, streamlines tractography algorithms may not be perfectly reversible / direction-agnostic, so tracking in both directions may give a more comprehensive reconstruction.
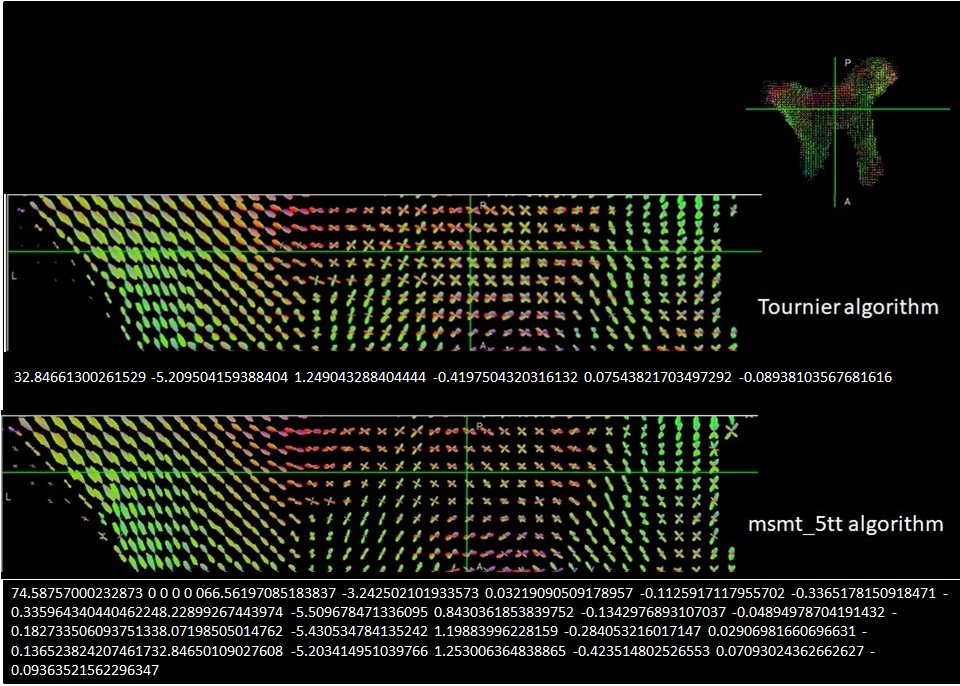
Actually, the data is ex-vivo human optic chiasm diffusion MRI (4 and 5 shell ). I did tractography according to suggestion of @rsmith that works fine for my data. Now, I am just thinking that how I can interpret the values of response function and make sure that the estimated response function and FOD maps are good or ideal estimations. here is the FOD maps and response function based on tournier algorithm and msmt_5tt algorithm. It would be great if you ,mrtrix experts, could give me an explanation about this issue.
Given you are showing two different FOD images, these results are dependent on not only the algorithm used to determine the response functions, but also the method used to estimate FODs based on one or more response functions. Did you use dwi2fod csd for the top image and dwi2fod msmt_csd for the lower image? Since dwi2response tournier and dwi2response mamt_5tt provide single-tissue and multi-tissue response functions respectively, they cannot be naively provided to the same FOD estimation algorithm.
In the lower figure, it looks like the importing of response function coefficients has ignored newline characters, and thus it is very difficult to distinguish the numbers corresponding to each row as they appear in the file (should be 6 numbers per row, with the number of rows equal to the number of unique b-values in the DWI data).
Over and above that, while the coefficients seem reasonable, with such limited information we really only have the capability to identify egregious errors; it will be up to you to analyse the data critically and determine whether the algorithms are behaving as they should.