# FBA:How to display one subject's the VALUE of FD,FC and FDC
**URL:** https://community.mrtrix.org/t/fba-how-to-display-one-subjects-the-value-of-fd-fc-and-fdc/4094
**Category:** Uncategorized
**Created:** [September 17, 2020, 2:12pm UTC](https://community.mrtrix.org/t/fba-how-to-display-one-subjects-the-value-of-fd-fc-and-fdc/4094 "2020-09-17T14:12:55Z")
**Posts on this page:** 11
**Page:** 1
### Author:  [@silver\_mark](https://community.mrtrix.org/u/silver_mark)
#### Post date: [September 17, 2020, 2:12pm UTC](https://community.mrtrix.org/t/fba-how-to-display-one-subjects-the-value-of-fd-fc-and-fdc/4094/1 "2020-09-17T14:12:55Z")
Hi,MRtrix experts
I followed [https://mrtrix.readthedocs.io/en/latest/fixel\_based\_analysis/mt\_fibre\_density\_cross-section.html#assign-subject-fixels-to-template-fixels](https://mrtrix.readthedocs.io/en/latest/fixel_based_analysis/mt_fibre_density_cross-section.html#assign-subject-fixels-to-template-fixels) and finished 1-22 steps.
I take two subjects two timing to try to analyse(001:subject one;002:subject two;pre:preradiotherapy;after:after radiotherapy).And,Group A:001\_pre,002\_pre;Group B:001\_after,002\_after.pre=control,after=patient.
I want to view one subject’s FD(FC,and FDC) value in one time plot.But I don’t know if what I display is true.
Take 001\_pre as example:
FD:
mrview dwi\_denoised\_unring\_preproc\_upsampled.mif
then overlay template/fd/001\_control.mif.Colourmap choose Hot.Then,the result is shown in this figure.
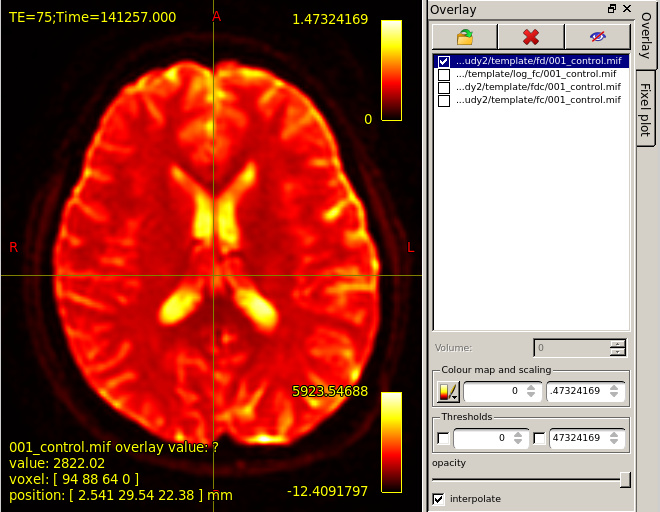
However,base on the “mrview” above,I choose fixel plot and overlay template/fd/index.mif.The result is shown in figure 2.
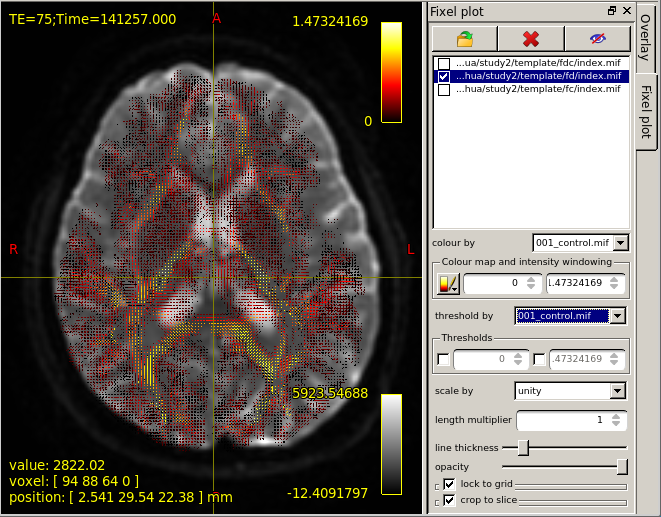
I don’t know what the FD(FC,FDC) value actually look like and the correct way to display FD(FC FDC) value.
FC:
And,when I view FC from my processed data,I can’t believe my eyes.
mrview mrview dwi\_denoised\_unring\_preproc\_upsampled.mif
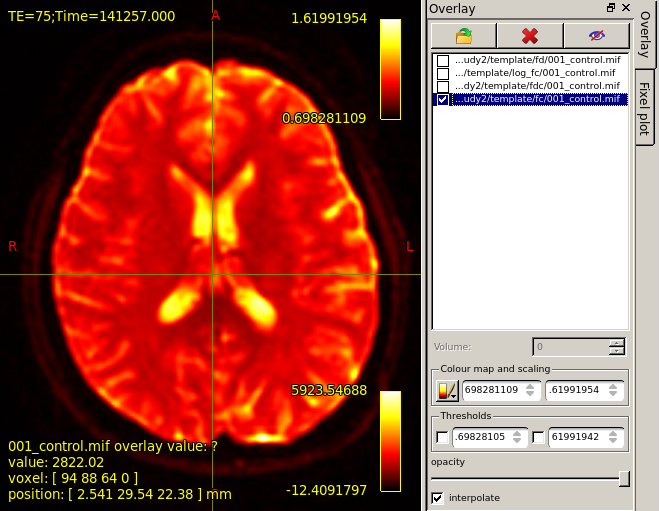
overlay template/fc/001\_control.mif.Colourmap choose Hot.Result as the third figure shows.It seems that there is no difference between Figure1 and Figure3.
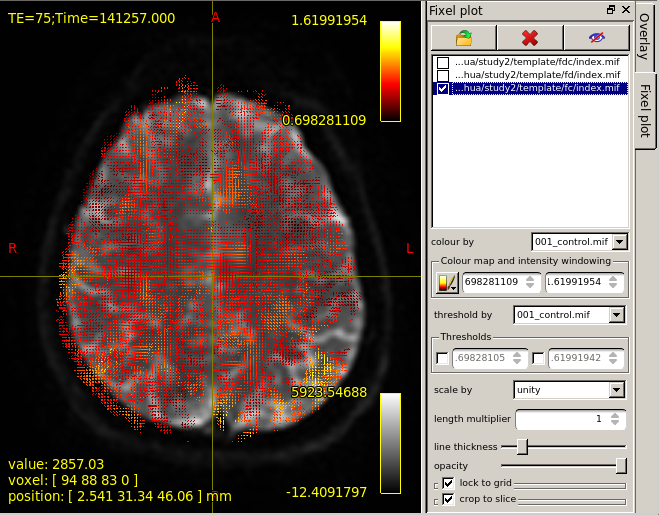
Then,I choose fixel plot and overlay template/fc/index.mif.The result is outrageous. The resulting map goes beyond the region of the brain.
FDC:
like above.Figure 5 is the result of I overlay template/fdc/001\_control.mif.Figure 6 is the result of I use “fixel plot” to overlay
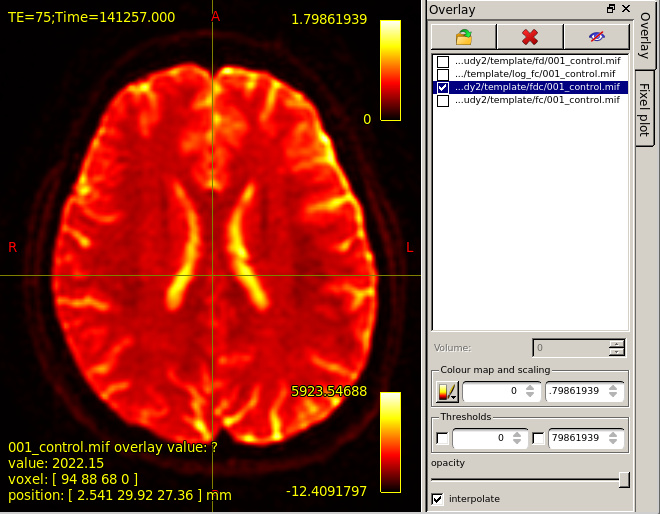
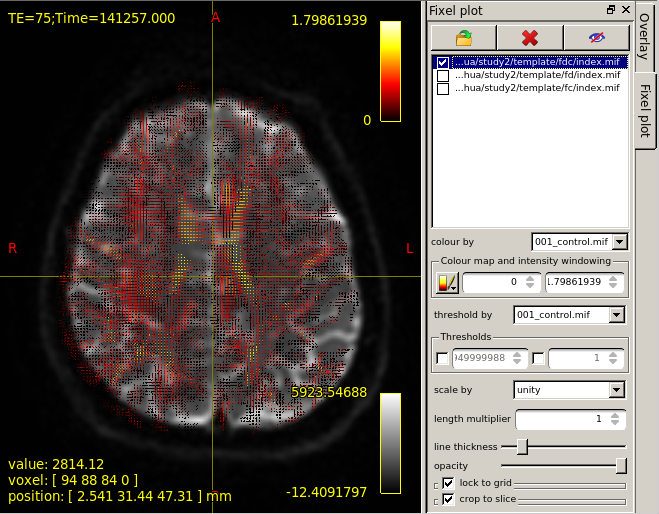
In a word,what I displayed are awful.Three figures of overlaying FD,FC,FDC value are not so different.What’s more,“fixel plot” of FC and FDC resulting maps beyond the region of the brain.
How can I solve these problems?
And,in Step 23,base on my test dataset,how should I set the design\_matrix and contrast\_matrix?How can I visualise the fixel-fixel connectivity matrix generated in Step 21?
I would be very grateful if you could help me solve this problem.
Thanks,
Silver
---
### Author:  [@jdtournier](https://community.mrtrix.org/u/jdtournier)
#### Post date: [September 18, 2020, 2:19pm UTC](https://community.mrtrix.org/t/fba-how-to-display-one-subjects-the-value-of-fd-fc-and-fdc/4094/2 "2020-09-18T14:19:02Z")
OK, there’s quite a lot going on here, I’ll try to unpack:
- first off, the `fc.mif` file you’re trying to display is in the fixel format ([full description here](https://mrtrix.readthedocs.io/en/latest/fixel_based_analysis/fixel_directory_format.html)). That image contains a linear array of values, one for each fixel. If you display it, it’ll be a very long line of values, and will most likely appear out of plane so you won’t see it. It’s not designed to be displayed that way. The `index.mif` image can be displayed, and contains the information needed to interpret the other images (including `fc.mif`).
- You can’t display fixel data as regular images, since the whole point of the format is that you can store _multiple_ fixels per voxel. Therefore, it’s not something you can display with the overlay tool, since that expects regular one value per voxel data.
- You’re trying to overlay the fixel data in template space (e.g. `template/fdc/001_control.mif`) on top of the DWI for a single subject (`dwi_denoised_unring_preproc_upsampled.mif`). They’re not going to be aligned, unless you’ve also coregistered the DWI to the template (which I hope you _haven’t_ done, we wouldn’t recommend it). So the misregistration you’re seeing is entirely normal and expected. A more appropriate image over which to display the fixel data might be the FOD template image, or the template `index.mif` image.
Hopefully that answers all of your questions…?
---
### Author:  [@silver\_mark](https://community.mrtrix.org/u/silver_mark)
#### Post date: [September 19, 2020, 7:41am UTC](https://community.mrtrix.org/t/fba-how-to-display-one-subjects-the-value-of-fd-fc-and-fdc/4094/3 "2020-09-19T07:41:03Z")
Hi,J-Donald Tournier
I am so glad that you can read my post and reply to me.
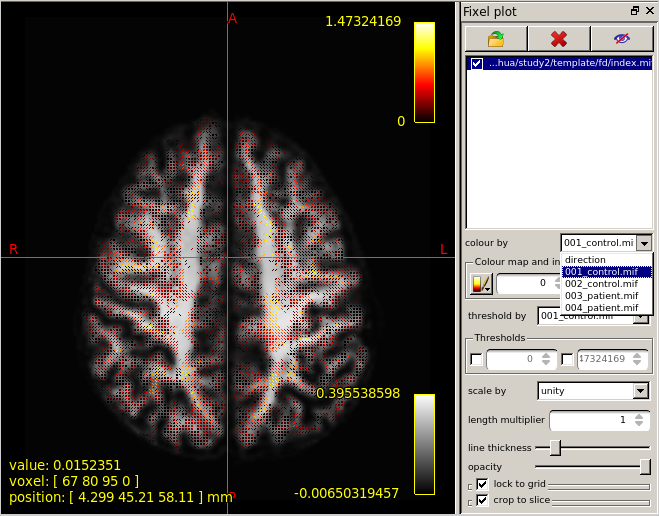
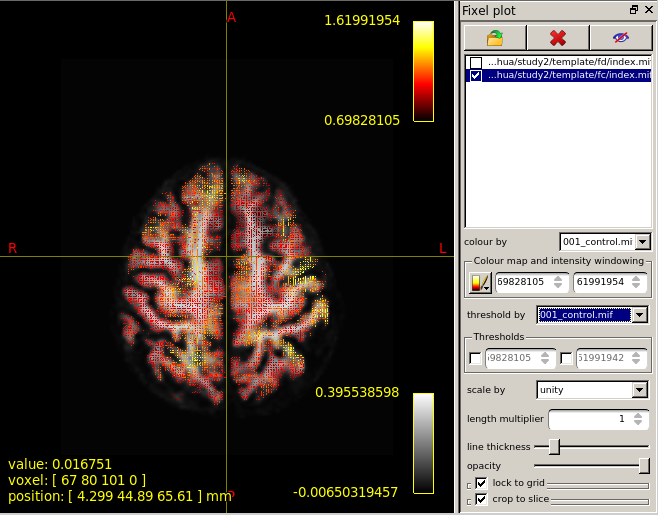
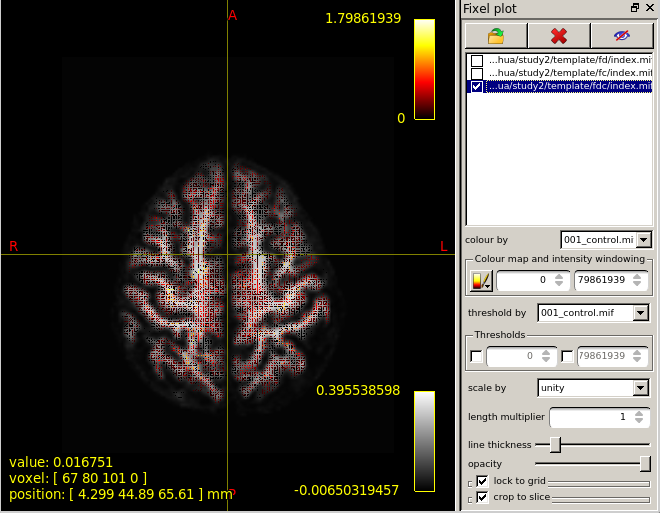
Next,I took 001\_control as a example to display a single subject’s FD,FC and FDC.
Another question,Is the Colour Bar in the upper right corner of the following three figures showing the FD,FC and FDC value range for this single subject(001\_control)?
Lastly,base on my grouping[I take two subjects two timing to try to analyse(001:subject one;002:subject two;pre:preradiotherapy;after:after radiotherapy).And,Group A:001\_pre and 002\_pre;Group B:001\_after and 002\_after.pre=control,after=patient.],how should I set the design\_matrix and contrast\_matrix in Step23?How can I visualise the fixel-fixel connectivity matrix generated in Step21?
FD:
mrview wmfod\_template.mif and I ues Fixel plot to display"template/fd/001\_control.mif".And I see it can coloured by 002\_control,003\_patient and 004\_patient! So I know how to display a single subject’s FD value.
FC:
mrview wmfod\_template.mif and I ues Fixel plot to display"template/fc/001\_control.mif"
FDC:
mrview wmfod\_template.mif and I ues Fixel plot to display"template/fdc/001\_control.mif"
Thanks,
silver
---
### Author:  [@silver\_mark](https://community.mrtrix.org/u/silver_mark)
#### Post date: [September 19, 2020, 7:44am UTC](https://community.mrtrix.org/t/fba-how-to-display-one-subjects-the-value-of-fd-fc-and-fdc/4094/4 "2020-09-19T07:44:35Z")
Hi, J-Donald Tournier
I have finished reading your article “Investigating white matter fibre density and morphology using fixel-based analysis”.
I have a question:What is the range of FD value and FC value?Like FA(fractional anisotropy),It ranges from 0 to 1.
Thanks,
Silver
---
### Author:  [@jdtournier](https://community.mrtrix.org/u/jdtournier)
#### Post date: [September 19, 2020, 7:53am UTC](https://community.mrtrix.org/t/fba-how-to-display-one-subjects-the-value-of-fd-fc-and-fdc/4094/5 "2020-09-19T07:53:24Z")
> [@silver\_mark](#):
>
> Another question,Is the Colour Bar in the upper right corner of the following three figures showing the FD,FC and FDC value range for this single subject(001\_control)?
Yes. More precisely, for the fixel data file currently selected in the tool list view (on the right).
> [@silver\_mark](#):
>
> how should I set the design\_matrix and contrast\_matrix in Step23?
That’s a much bigger question, and entirely dependent on your study. I suggest you have a [look through this forum for suggestions](https://community.mrtrix.org/search?q=design%20contrast), or search online for information on how to set up a general linear model – there’s lots of excellent resources that will explain things much better than I could.
> [@silver\_mark](#):
>
> How can I visualise the fixel-fixel connectivity matrix generated in Step21?
I don’t think you can, it’s far too big to visualise, and would be near-impossible to interpret in any meaningful way. Maybe @rsmith can correct me if I’m wrong here…
---
### Author:  [@jdtournier](https://community.mrtrix.org/u/jdtournier)
#### Post date: [September 19, 2020, 8:15am UTC](https://community.mrtrix.org/t/fba-how-to-display-one-subjects-the-value-of-fd-fc-and-fdc/4094/6 "2020-09-19T08:15:32Z")
> [@silver\_mark](#):
>
> What is the range of FD value and FC value?Like FA(fractional anisotropy),It ranges from 0 to 1.
It’s not that simple, there’s no hard limits like there might be for FA. In general, FC should be around 1±20% (it’s a scale factor), and FD tends to be between 0 & 0.3 or so, but it might go quite a bit above that for various reasons.
---
### Author:  [@silver\_mark](https://community.mrtrix.org/u/silver_mark)
#### Post date: [September 19, 2020, 8:43am UTC](https://community.mrtrix.org/t/fba-how-to-display-one-subjects-the-value-of-fd-fc-and-fdc/4094/7 "2020-09-19T08:43:20Z")
yes.
Because in the papers studied by FBA method that I read, the result diagram shows the differences between two groups of people, but does not show the FD or FC value of one person or a group of people.So I don’t know whether FD or FC value also has a clear limit.
Like:
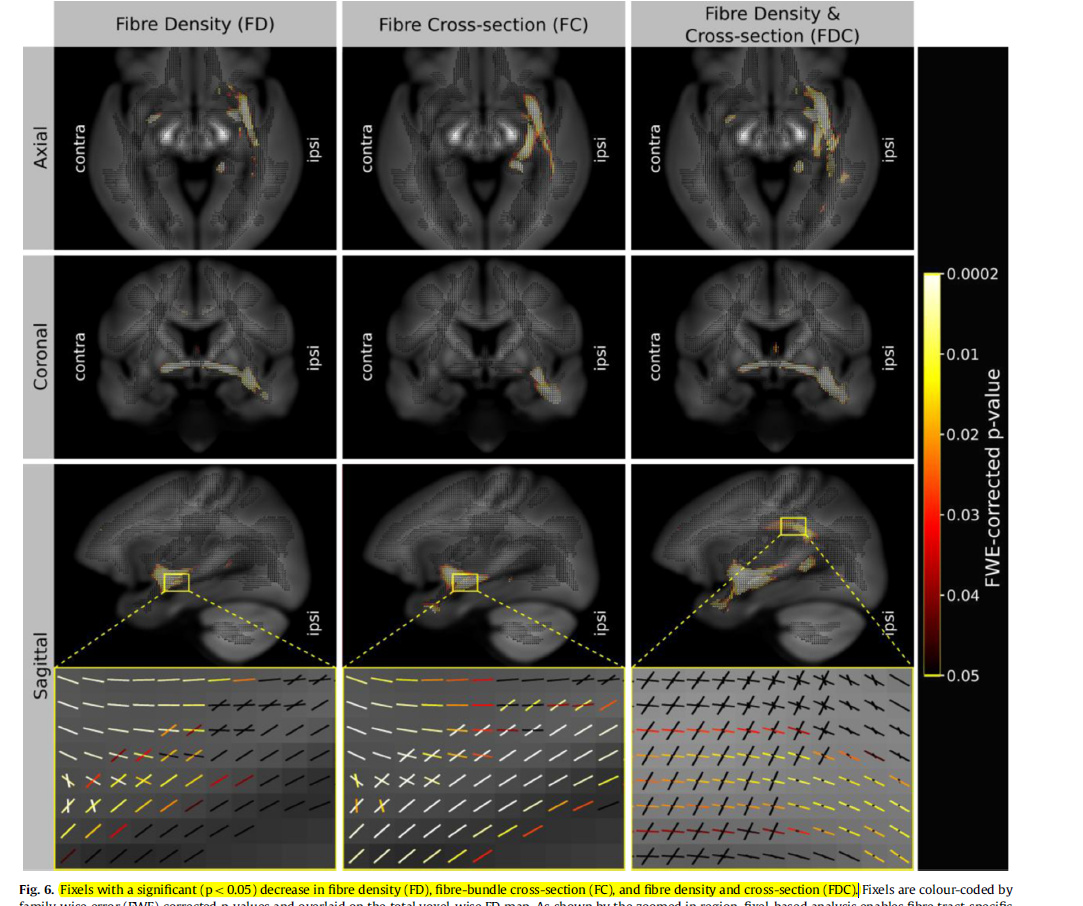
As I show one hour ago,I found FD values for the two subjects I selected ranged from 0 to 1.5(1.47324169,1.49300857,1.48639834,1.49554777).(I really want to know why it is so much higher than what you said between 0 and 0.3. Do you have any relevant literature that you can recommend to me?)
And the FC values for the two subjects I selected ranged from 0.6 to 1.6[Isn’t that a bit different from what you said: 1±20% (0.8-1.2)].
---
### Author:  [@rsmith](https://community.mrtrix.org/u/rsmith)
#### Post date: [October 1, 2020, 12:20am UTC](https://community.mrtrix.org/t/fba-how-to-display-one-subjects-the-value-of-fd-fc-and-fdc/4094/8 "2020-10-01T00:20:57Z")
> > What is the range of FD value and FC value?Like FA(fractional anisotropy),It ranges from 0 to 1.
> It’s not that simple, there’s no hard limits like there might be for FA. In general, FC should be around 1±20% (it’s a scale factor), and FD tends to be between 0 & 0.3 or so, but it might go quite a bit above that for various reasons.
- While FC should be 1.0 ± maybe 0.2, _log(FC)_, which is calculated within the example pipeline and for which statistical inference is recommended over FC itself, should have values of 0.0 ± 0.2.
- FC cannot drop below 0.0 as long as your non-linear transform is _diffeomorphic_. Note also that this is requisite for the calculation of _log(FC)_. Following the logarithm transform, there is theoretically no lower or upper bound on what the values _could_ be, but if you’re dealing with data of the same species, of comparable age, it would seem intuitively unusual to have expansion / dilation factors of e.g. 10% or 1000%.
- For FD, if you take your single-fibre WM response function, and use it to deconvolve a voxel containing a single WM fibre bundle of comparable DWI signal intensity, and then perform the explicit FOD segmentation process within the `fod2fixel` command, you should obtain a value of FD of around 1.0. It’s possible to obtain values of FD of greater than 1.0 as any single WM voxel may exceed the “fibre density” corresponding to that calculated from those image voxels used to derive the WM response function. This is why we’re always careful to never refer to these as “volume fractions”. Seeing values as high as 1.5 is not unusual. If there is no fixel in subject space that maps to a fixel in template space, then the value of FD for that template fixel will be 0.0. It is however not possible for there to be “negative fibre density”. By default the threshold applied during fixel segmentation to determine whether or not an FOD lobe results in a discrete fixel is based on _peak amplitude_ rather than _integral on the sphere_ (which is what determines FD), so while there will be some non-zero minimum value of FD for segmented fixels, I don’t know off the top of my head exactly what it is.
> I found FD values for the two subjects I selected ranged from 0 to 1.5(1.47324169,1.49300857,1.48639834,1.49554777).(I really want to know why it is so much higher than what you said between 0 and 0.3. Do you have any relevant literature that you can recommend to me?)
I suspect what’s happened here is an erroneous conflation between the fixel-wise FD measure and the intensity of the WM _l_=0 term of the spherical harmonic expansion (the “WM density” image you see if you load an ODF image as the main image in `mrview`). There is a factor of `sqrt(4pi)` difference between these two. So for the example I provided earlier, where you de-convolve a single-fibre WM voxel with a single-fibre WM response function of equal intensity, the value of the WM ODF _l_=0 image will in fact be ~0.282, whereas the value of FD of the segmented FOD lobe will be 1.0.
> And the FC values for the two subjects I selected ranged from 0.6 to 1.6[Isn’t that a bit different from what you said: 1±20% (0.8-1.2)].
If you are quoting _extreme values_ (i.e. the maximal values across all fixels for any particular subject), this isn’t problematic I don’t think. But “healthy variation” within major white matter bundles would be of the order of 20% as “typical values” rather than extrema.
> How can I visualise the fixel-fixel connectivity matrix generated in Step21?
No way currently. The construction of this format is pretty new, and for the vast majority of applications there’s no need to interact with these data visually, so there has been no motivation for me to implement any kind of visualisation mechanism.
Rob
---
### Author:  [@silver\_mark](https://community.mrtrix.org/u/silver_mark)
#### Post date: [October 6, 2020, 8:25am UTC](https://community.mrtrix.org/t/fba-how-to-display-one-subjects-the-value-of-fd-fc-and-fdc/4094/9 "2020-10-06T08:25:22Z")
Hi,Rob
Thank you for clearing me up.If I have any questions about the FD,FC and FDC values, I will consult you again.I hope you don’t mind. 😀
Silver
---
### Author:  [@rsmith](https://community.mrtrix.org/u/rsmith)
#### Post date: [April 27, 2022, 4:33am UTC](https://community.mrtrix.org/t/fba-how-to-display-one-subjects-the-value-of-fd-fc-and-fdc/4094/10 "2022-04-27T04:33:49Z")
A post was split to a new topic: [Range of subject FD values](https://community.mrtrix.org/t/range-of-subject-fd-values/5727)
---
### Author:  [@Hinke\_Halbertsma](https://community.mrtrix.org/u/Hinke_Halbertsma)
#### Post date: [April 5, 2023, 10:36am UTC](https://community.mrtrix.org/t/fba-how-to-display-one-subjects-the-value-of-fd-fc-and-fdc/4094/11 "2023-04-05T10:36:22Z")
> [@rsmith](#):
>
> If there is no fixel in subject space that maps to a fixel in template space, then the value of FD for that template fixel will be 0.0.
Hi @rsmith.
This is indeed what I thought. But I was wondering: how does fixelcfestats deal with these zeros? It’s not right to include these in the analyses right? Because it does not actually represent an FD value? I’m asking because I want to do some computations on the fixel data outside mrtrix and was wondering how to deal with these.
Three options that I considered: 1) removing the fixel from the analysis entirely if one or more subjects has an FD of 0.0 for that particular fixel, 2) replacing the 0.0 with NaN, but this brought other issues at a later stage (I want to run a PCA and PCA doesn’t like NaNs), 3) replacing the fixel with an average FD fixel value of the entire sample or of the subgroup (i.e. the patients in case of a patient, or the controls in case of a control subject).
Best wishes,
Hinke