# How to improve the FBA results?
**URL:** https://community.mrtrix.org/t/how-to-improve-the-fba-results/4453
**Category:** Uncategorized
**Created:** [January 12, 2021, 9:30am UTC](https://community.mrtrix.org/t/how-to-improve-the-fba-results/4453 "2021-01-12T09:30:53Z")
**Posts on this page:** 9
**Page:** 1
### Author:  [@silver\_mark](https://community.mrtrix.org/u/silver_mark)
#### Post date: [January 12, 2021, 9:30am UTC](https://community.mrtrix.org/t/how-to-improve-the-fba-results/4453/1 "2021-01-12T09:30:53Z")
Hi,all
I want to know how to improve FBA (fixel-based analysis) results?
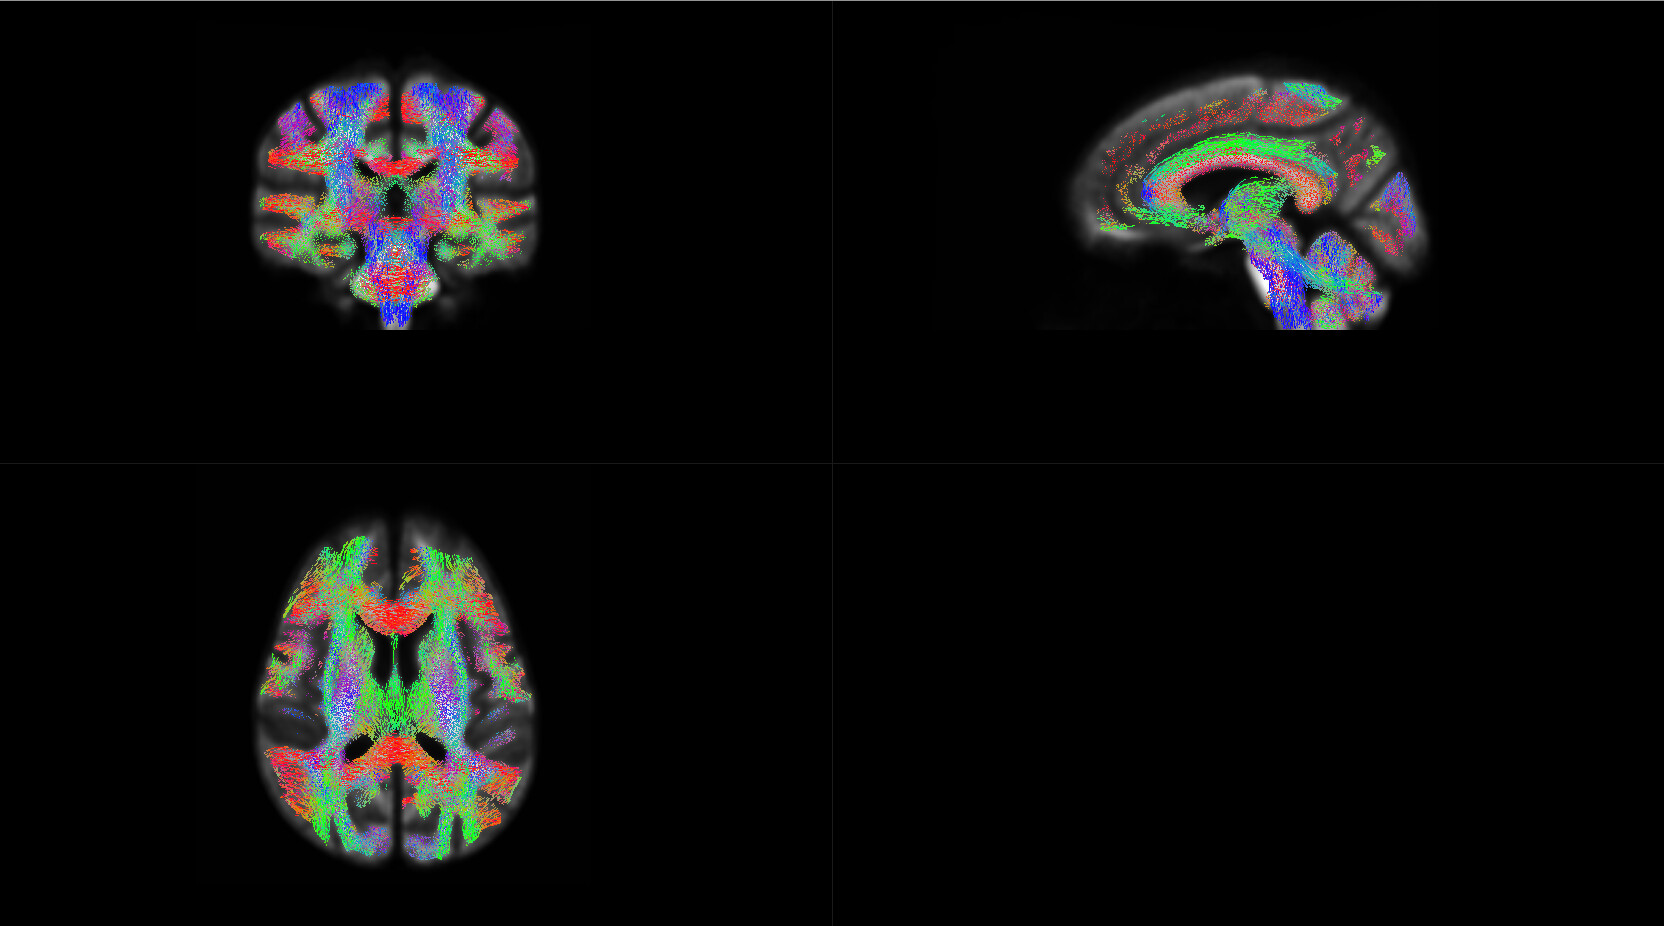
This is the result I made according to [these steps](http://userdocs.mrtrix.org/en/latest/fixel_based_analysis/mt_fibre_density_cross-section.html).The first graph shows the corrected (1-P) value,and the second graph shows the uncorrected (1-P) value.Most (1-p) values are not significant after correction.Is this normal?
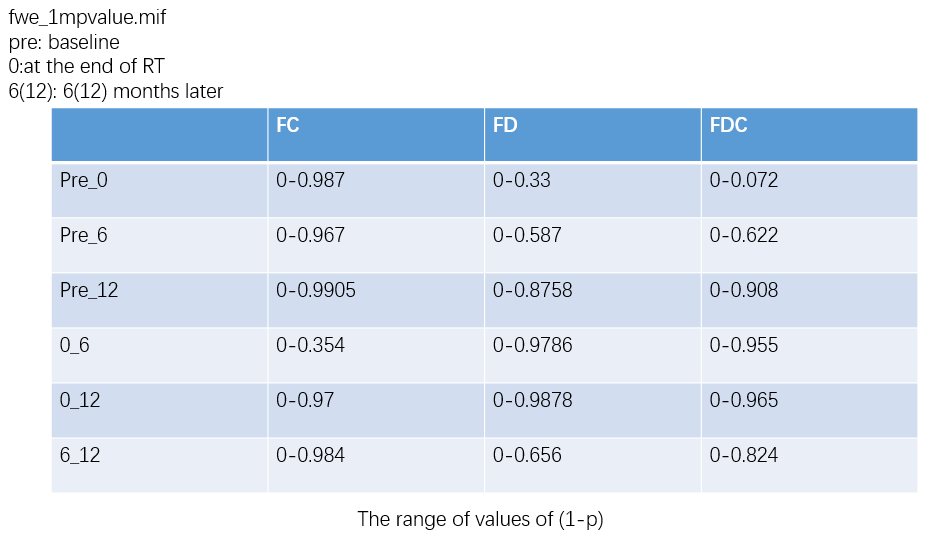
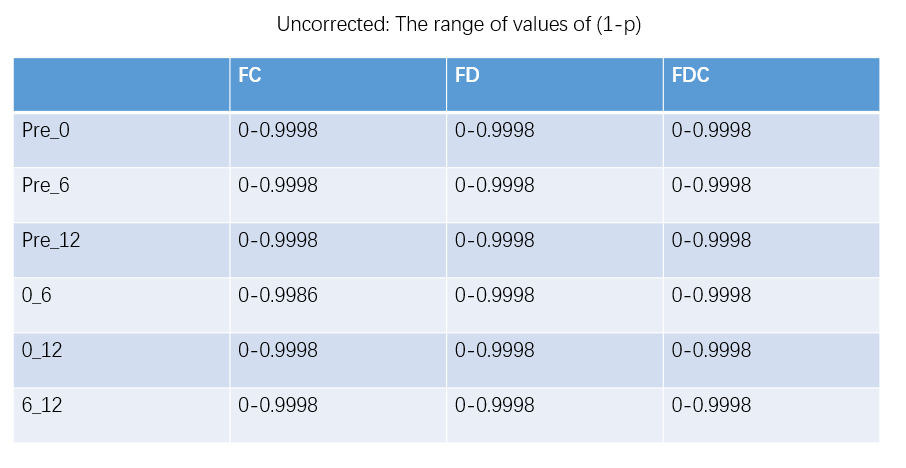
Take FC (Pre vs 12) as example:
The range of the fwe-corrected (1-p) value is 0-0.9905 and the uncorrected (1-p) value’s range is 0-0.9998.
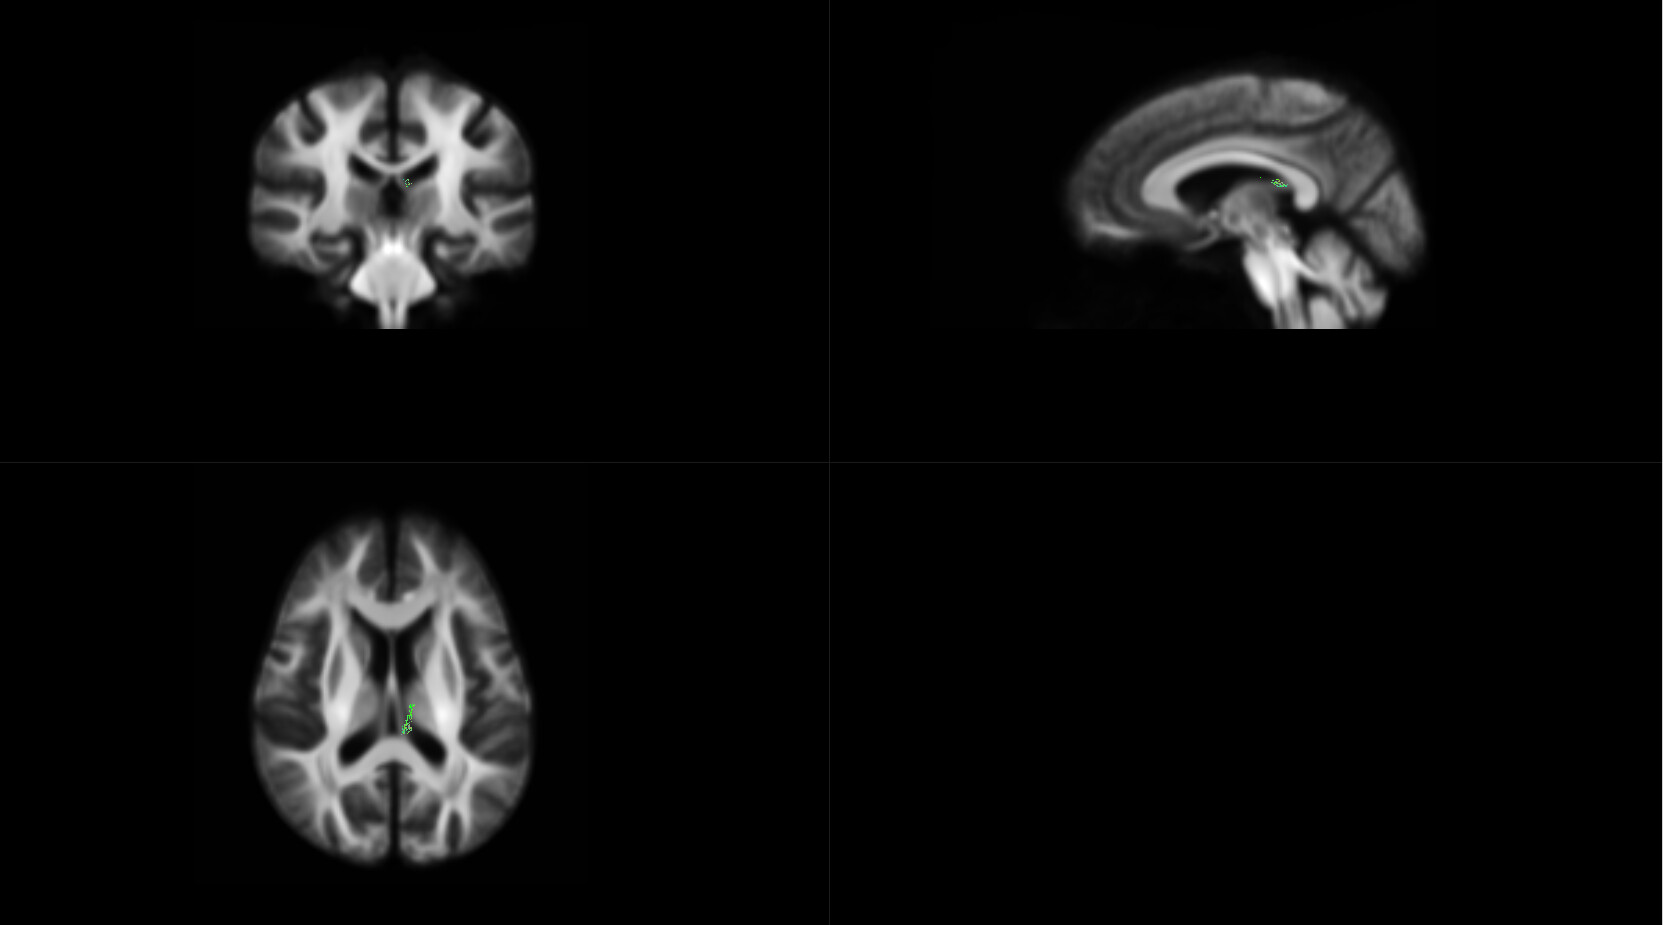
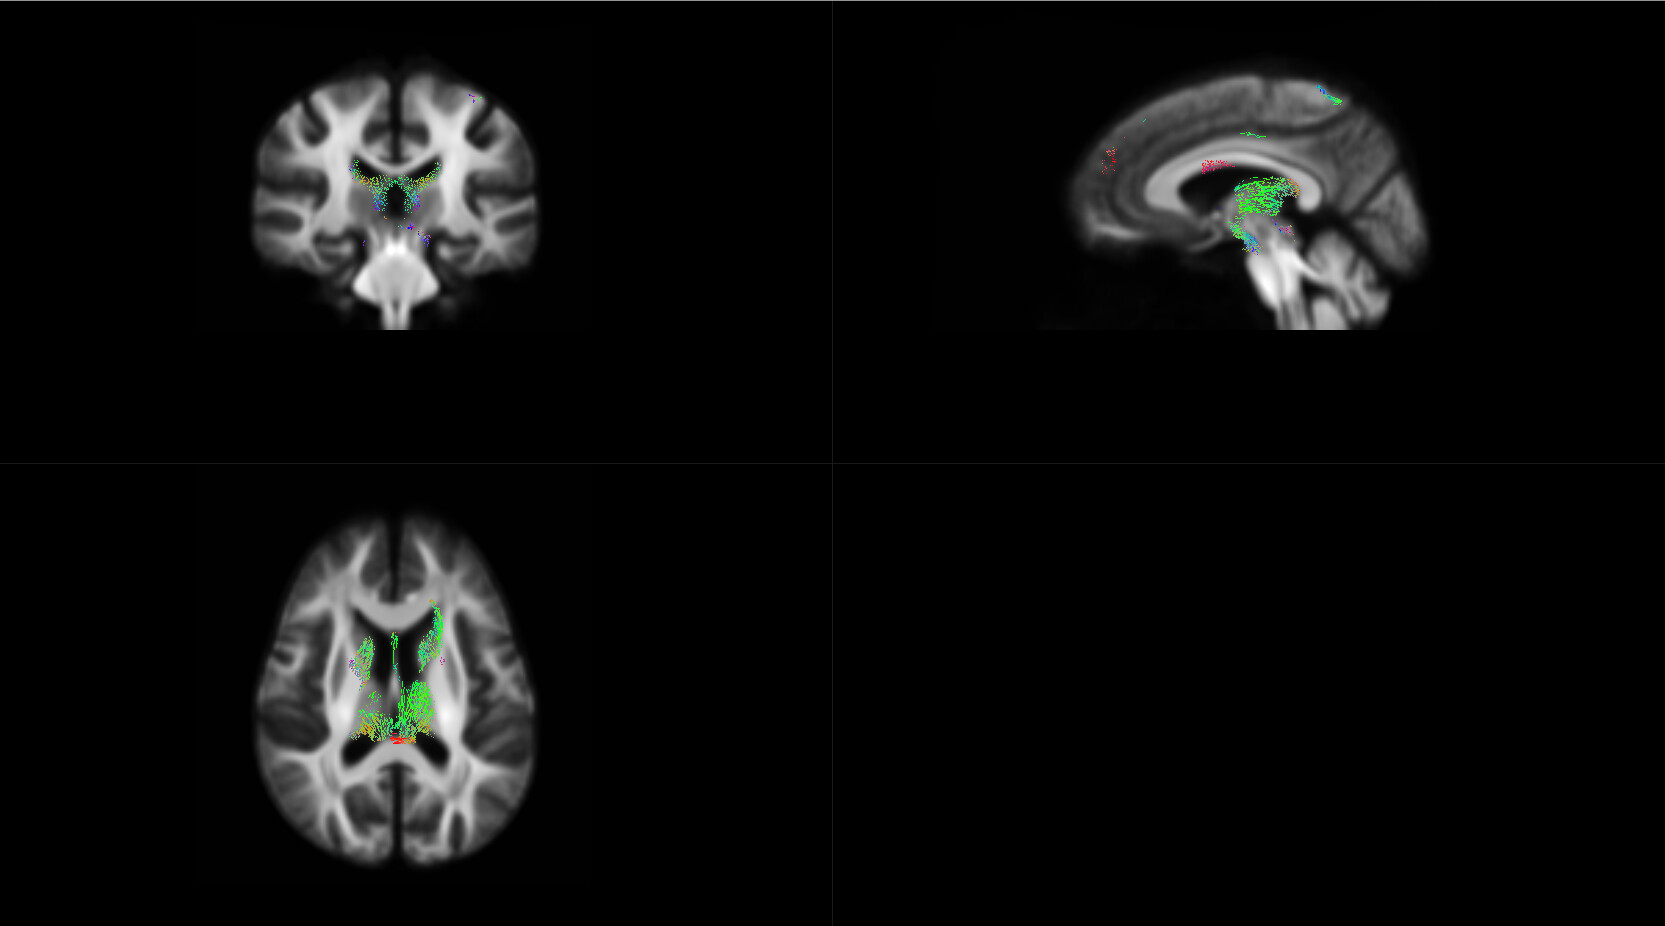
The first graph below shows the streamlines threshold 0.95-0.9905 (fwe-corrected), and the second graph below shows the streamlines threshold 0.95-0.9905 (uncorrected).
1、Why does the first diagram show so few significant streamlines? Is that normal?Is there a way to make the results better?Or is it just that?
2、The third diagram shows whole-brain tracking streamlines (20 million SIFT to 2 million),Does it look right?
Lastly,How to understand the “Connectivity Based Fixel Enhancement and Non-parametric Permutation Testing” in FixelCfestats command? I read this article——“Connectivity-based fixel enhancement: Whole-brain statistical analysis of diffusion MRI measures in the presence of crossing fibres” but I still don’t know what CFE is.Is CFE is a statistical analysis method like"Paired T test"? and, which testing method is used in " non-parametric permutation testing" ?

Your advice and help are greatly appreciated.
Thanks,
Silver
---
### Author:  [@jdtournier](https://community.mrtrix.org/u/jdtournier)
#### Post date: [January 13, 2021, 10:19am UTC](https://community.mrtrix.org/t/how-to-improve-the-fba-results/4453/2 "2021-01-13T10:19:18Z")
> [@silver\_mark](#):
>
> Most (1-p) values are not significant after correction.Is this normal?
Yes, in general, any correction for multiple comparisons (which this is) will increase your _p_-values (i.e. decrease significance). There’s not much we can do about this, it’s a general statistical result (see e.g. [here for details](https://en.wikipedia.org/wiki/Multiple_comparisons_problem)).
> [@silver\_mark](#):
>
> 1、Why does the first diagram show so few significant streamlines? Is that normal?Is there a way to make the results better?Or is it just that?
As above: yes, this is normal, and without acquiring more data, there isn’t anything simple that can be done to improve these results (assuming all the processing steps have been performed as well as they can). The statistical correction procedures used in CFE are already pretty much as good as we can make them. There are a few things that @rsmith is working on, but I don’t expect they will make an enormous difference to your results, and they certainly won’t make your corrected results as extensive as the uncorrected ones.
> [@silver\_mark](#):
>
> 2、The third diagram shows whole-brain tracking streamlines (20 million SIFT to 2 million),Does it look right?
It looks plausible, but it’s impossible to tell from a simple snapshot like this – there are far too many streamlines to get a sense of streamline density. A better way to verify is to generate the corresponding TDI (using `tckmap`) and compare with the WM FOD that was used to generate the streamlines in the first place (e.g. figure 9 in the [SIFT paper](https://pubmed.ncbi.nlm.nih.gov/23238430/))
> [@silver\_mark](#):
>
> Lastly,How to understand the “Connectivity Based Fixel Enhancement and Non-parametric Permutation Testing” in FixelCfestats command? I read this article——“Connectivity-based fixel enhancement: Whole-brain statistical analysis of diffusion MRI measures in the presence of crossing fibres” but I still don’t know what CFE is.Is CFE is a statistical analysis method like"Paired T test"? and, which testing method is used in " non-parametric permutation testing" ?
CFE refers to the overall framework for correction for multiple comparisons using permutation testing, with statistical enhancement along white matter pathways based on estimates of connectivity derived using tractography. The framework in general is relatively agnostic to the exact test performed for each fixel, but the current implementation will typically perform a _t_-test for each fixel ([the ability to perform an _F_-test has also recently been introduced](https://community.mrtrix.org/t/mrtrix-3-0-rc3-3-0-0-changelog/3552/3)). I’m not sure this answers your question, but I can’t think of a way to explain this simply without referring you to the CFE article – it’s quite an involved framework!
---
### Author:  [@silver\_mark](https://community.mrtrix.org/u/silver_mark)
#### Post date: [January 14, 2021, 8:10am UTC](https://community.mrtrix.org/t/how-to-improve-the-fba-results/4453/3 "2021-01-14T08:10:39Z")
> [@jdtournier](#):
>
> CFE refers to the overall framework for correction for multiple comparisons using permutation testing,
Here’s my understanding of the “fixelcfestats” command: design\_matrix and contrast\_matrix are designed according to the statistical method that I selected,like two sample paired T-test or two sample unpaired T test.Then each fixels value like FD,FC or FDC on two groups will be compared according to the statistical method that I selected.
Hence,my puzzle is: at what step is CFE implemented?Before I do the statistics I want (like I choose paired T test)? Or later? More succinctly, what role does CFE play in “fixelcfestats” commands?
Thanks,
Silver
---
### Author:  [@jdtournier](https://community.mrtrix.org/u/jdtournier)
#### Post date: [January 14, 2021, 12:02pm UTC](https://community.mrtrix.org/t/how-to-improve-the-fba-results/4453/4 "2021-01-14T12:02:55Z")
OK, so there is indeed a _t_-test (or _F_-test) performed per fixel. If that’s all it was, you’d still need to figure out how to convert that to _p_-values, taking into account the many multiple comparisons being performed and how independent these tests are.
In ‘classical’ statistics, this might be done by looking at the area under the curve of the probability density function (PDF) for the _t_-value assuming the null hypothesis (no effect), and potentially applying a Bonferoni or False Discovery rate correction to account for the multiple comparisons. But that only works under the specific assumptions of Normality, constant variance, independence of tests, etc, and this translate poorly to the massive multiple comparisons problems with quite a bit of dependence between tests that we typically deal with in neuroimaging (see e.g. the [recent controversy regarding the validity of cluster-wise parametric statistics in fMRI](https://www.pnas.org/content/113/28/7900))
For these (and many other) reasons, non-parametric permutation testing approaches are increasingly being used instead. This now involves performing the original per-fixel _t_-test, but also a large number of equivalent _t_-tests with random permutations of the data (e.g. random group assignment), the purpose of which is to derive an _empirical_ estimate of the PDF of the statistic of interest (_t_-test in this case) under the null hypothesis. So that’s one aspect: yes, there are _t_-tests per fixel, but there’s actually a few thousand of them per fixel, not just one.
The next aspect is that to ensure sufficient control of false positives over _all_ the tests being performed, the permutation testing records the _maximum_ _t_-value over all the tests (i.e. all fixels) for each permutation, and generates an estimate of the PDF of the maximal _t_-value under the null. That is then used to map the actual _t_-values computed to _p_-values corrected for multiple comparisons, and that will inevitably mean higher (less significant) _p_-values than the uncorrected (per-fixel) version.
The final aspect is to try to recover some statistical power by making use of the assumption that changes along one fixel are likely to correlate with changes along other fixels in the same WM pathway. This is the connectivity-based fixel enhancement (CFE) part, and this makes use of whole-brain tracrography to yield estimates of fixel-fixel connectivity, which can then be used to ‘enhance’ _t_-values using a modified version of the [threshold-free cluster enhancement (TFCE)](https://pubmed.ncbi.nlm.nih.gov/18501637/) approach proposed by Steve Smith in 2009. With these modifications, for each permutation, the _t_-values are computed (for e.g. random group assignment), enhanced using the adapted TFCE procedure, and the maximal _enhanced_ _t_-value is recorded. This then produces the PDF of the maximal _enhanced_ _t_-values, from which _p_-values can be computed that are corrected for multiple comparisons, under the assumption that effects occur along pathways (i.e. we expect correlations between strongly ‘connected’ fixels).
So that’s essentially a summary of the statistical procedure used in fixel-based analysis, hopefully that’ll clarify how the different bits fit together.
All the best,
Donald.
---
### Author:  [@rsmith](https://community.mrtrix.org/u/rsmith)
#### Post date: [January 21, 2021, 7:05am UTC](https://community.mrtrix.org/t/how-to-improve-the-fba-results/4453/5 "2021-01-21T07:05:03Z")
> [@silver\_mark](#):
>
> I want to know how to improve FBA (fixel-based analysis) results?
I like how you think that we have an existing stash of tricks for making FBA better that we don’t already tell people to use 😆 😄
1. Make sure that you are using version `3.0.0` or newer; that includes [this change](https://www.researchgate.net/publication/332495541_Intrinsic_non-stationarity_correction_for_Fixel-Based_Analysis), which can make a substantial difference especially in smaller cohorts.
2. Partly as a consequence of 1.: Take a look at the generated image “`null_contributions.mif`”. What this image should ideally look like is a random homogeneous scattering of fixels with very low values, e.g. 1-5. If instead you can find a small number of fixels with very large values, e.g. over 10-15, this is a problem.
The way to address this is to constrain your statistical inference to a fixel mask containing fixels for which there is adequate streamlines-based connectivity. Currently this can be done just based on streamline count (`tck2fixel | mrthreshold`); in the future I’ll make it possible to do this based on the extent of fixel-fixel connectivity, which would be better.
3. Take a look at the various fixel data files output by the `fixelcfestats` command. E.g. even if there is no statistically significant effect reported, you can still quantify the standard effect size (/ Cohen’s _d_), and see its spatial distribution.
> Why does the first diagram show so few significant streamlines? Is that normal?
It’s important to keep in mind that statistical inference like FBA does _not_ tell you “where the differences are”; it tells you “if there are differences of sufficient robustness; and if so, where they are”. If every single FBA performed yielded extensive significant differences, I’d actually be slightly concerned. That’s not to say that there isn’t any effect present in your data, it’s just that the intrinsic variance in your data combined with the stringent nature of assignment of statistical inference means that it can’t be reported at the pre-specified inference threshold.
> CFE refers to the overall framework for correction for multiple comparisons using permutation testing, with statistical enhancement along white matter pathways based on estimates of connectivity derived using tractography.
There _can_ be a little bit of ambiguity here. Personally when I use the phrase CFE it tends to be specifically in reference to the enhancement of statistics produced by the GLM according to fixel-fixel connectivity, _not_ the entire GLM / statistical enhancement / permutation testing block of FBA, particularly since for the latter the code is shared wholesale across connectome / voxel / fixel stats. But maybe that’s just because I’m working away within the guts of it at a finer granularity than most… 🤓
Rob
---
### Author:  [@silver\_mark](https://community.mrtrix.org/u/silver_mark)
#### Post date: [January 25, 2021, 1:41pm UTC](https://community.mrtrix.org/t/how-to-improve-the-fba-results/4453/6 "2021-01-25T13:41:50Z")
Hi,Rob
> [@rsmith](#):
>
> Partly as a consequence of 1.: Take a look at the generated image “`null_contributions.mif`”. What this image should ideally look like is a random homogeneous scattering of fixels with very low values, e.g. 1-5. If instead you can find a small number of fixels with very large values, e.g. over 10-15, this is a problem.
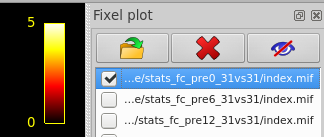
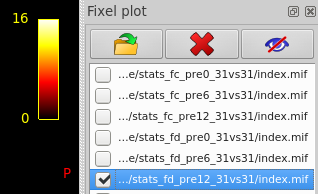
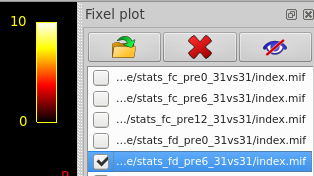
OK,I check the “null\_contributions.mif”.And,as shown in the figure below,when I compared FD value between pre-therapy and 12 months after ending therapy,I can find a small number of fixels with large values,e.g. maximum value is 16.
> [@rsmith](#):
>
> this is a problem.
What is the problem?
Thanks,
Silver
---
### Author:  [@rsmith](https://community.mrtrix.org/u/rsmith)
#### Post date: [February 4, 2021, 6:12am UTC](https://community.mrtrix.org/t/how-to-improve-the-fba-results/4453/7 "2021-02-04T06:12:41Z")
> OK,I check the “null\_contributions.mif”.And,as shown in the figure below,when I compared FD value between pre-therapy and 12 months after ending therapy,I can find a small number of fixels with large values,e.g. maximum value is 16.
Well, if it’s just one fixel with a value of 16, it might not be a problem. If you had 200 fixels with a value of 16, that would be a problem.
> What is the problem?
Was trying to avoid this 😅
Let’s say hypothetically that there’s “something wrong” with the statistical enhancement algorithm. For some reason, _even when the data are being shuffled_, one troublesome fixel consistently gets extremely high statistical enhancement values. For each shuffle, it is the maximal enhanced statistic anywhere in the image that is contributed to the null distribution (this is what guarantees familywise error rate control). So this one fixel contributes to the null distribution on every single shuffle (and it would therefore have a value of 5000 in this fixel data file). You now have a null distribution with extremely large values. When you _don’t_ shuffle the data and test your actual hypothesis, the rest of the fixels in your image can’t receive enough statistical enhancement to exceed the 95th percentile of this null distribution and therefore be labelled as statistically significant. So you end up with no statistically significant fixels and don’t know why.
Why might such a thing happen?
Well, imagine that you are using empirical non-stationarity correction using [this method](http://www.sciencedirect.com/science/article/pii/S1053811910012917), which is activated using the `-nonstationarity` option. The purpose of this is to try to provide homogeneous statistical power throughout the whole template, rather than having more statistical power in some regions than others purely due to their location in the template. Without going into all of the details, it works something like this:
1. Characterise how much statistical enhancement different fixels receive by chance; i.e. even when there’s no effect in the data (achieved via shuffling), some fixels will _still_ get more statistical enhancement than others.
2. When performing CFE on your actual data (and indeed also while generating the null distribution), whatever enhanced statistics are generated, _divide_ these values by those calculated in step 1 in order to correct for those differences in how much statistical enhancement they receive.
Now if all is well, this method works entirely reasonably. The problem with taking this method from voxel-based stats and utilising it in fixel-wise stats is that it is far more likely to be the case where there are fixels in the template that are _entirely disconnected_ from the rest of the template, due to the FOD template tractogram not intersecting them with any streamlines. These fixels obtain _tiny_ “enhanced” statistic values (which aren’t actually enhanced by any other fixels at all) in step 1. What happens when you divide a number by a tiny value? ⤴
Now isn’t this doing exactly what it’s supposed to? Those disconnected fixels have very poor statistical power due to receiving no statistical enhancement, and so it _makes sense_ that they should be “boosted” by the empirical non-stationarity correction.
Now consider what happens when you have _many_ such fixels, and you are shuffling your data in the generation of a null distribution. By chance alone, it’s likely that one of those fixels is going to acquire a moderately large test statistic value, which is going to be blown out of proportion by the non-stationarity correction. That’s then the maximal value that’s going to be taken from the data and appended to the null distribution for that shuffle. And this happens for every shuffle, because you have a large number of disconnected fixels, and on every shuffle, purely by chance one of them is going to obtain a large test statistic. So you end up with a null distribution with extremely large values, and when you threshold your actual data at whatever enhanced test statistic corresponds to _p_=0.05 you don’t see anything.
This is I believe why a number of people have reported that “paradoxically” their statistical results are reduced when using non-stationarity correction. I suspect it’s not actually paradoxical in many instances, it just requires looking at the data a little more closely. My figuring out what was going on here is the reason why `fixelcfestats` now outputs the `null_contributions.mif` image every time.
Okay. But you’re not using empirical non-stationarity correction, right? So why is this concern being raised? Well, you’re not using _empirical_ non-stationarity correction; but you _are_ almost certainly using [_intrinsic_ non-stationarity correction](https://www.researchgate.net/publication/332495541_Intrinsic_non-stationarity_correction_for_Fixel-Based_Analysis). When you look at the expression in that abstract, there’s similarly a term in the denominator that’s based on fixel-fixel connectivity. If that term is exceptionally small for some fixels, there’s the prospect of a similar effect occurring. This is why many users will have noticed a new warning message in `fixelcfestats` talking about disconnected fixels being excluded from statistical inference: that’s me trying to mitigate this issue. With this basic threshold in place, in my own experience this overall effect does not manifest to the same extent using intrinsic non-stationarity correction as what it does with the empirical non-stationarity correction technique; but there is always the chance that in somebody else’s data that it may manifest, and they will then come on here complaining that FBA doesn’t produce good results… 🙃
Using a fixel mask for statistical inference that excludes fixels that don’t possess enough fixel-fixel connectivity would be preferable, and I intend to modify the documented pipeline to include this. One can currently use `tck2fixel` to get a streamline _count_ per fixel and threshold that, and in `3.1.0` it should be possible to do such thresholding based on the [_extent_ of fixel-fixel connectivity](https://github.com/MRtrix3/mrtrix3/pull/2273), which is maybe a more tailored solution.
* * *
**TL;DR** : If the values in that “null contributions” image are not scattered approximately homogeneously throughout the template, but there are instead a small number of fixels with large values, you’re not getting as much statistical power as you could.
Cheers
Rob
---
### Author:  [@XL258W](https://community.mrtrix.org/u/XL258W)
#### Post date: [March 7, 2021, 7:21pm UTC](https://community.mrtrix.org/t/how-to-improve-the-fba-results/4453/8 "2021-03-07T19:21:55Z")
Hi Rob,
> [@rsmith](#):
>
> For each shuffle, it is the maximal enhanced statistic anywhere in the image that is contributed to the null distribution (this is what guarantees familywise error rate control). So this one fixel contributes to the null distribution on every single shuffle (and it would therefore have a value of 5000 in this fixel data file).
Am I right that you mean the value in each voxel of the “null\_contributions.mif” image represent the number of times that this voxel contribute to the maximal statistic across the brain during each shuffling?
My problem is that when I checked my “null\_contributions.mif” image, the values are from 0 to 5. But most of the values are 0 (see below). I think it is incorrect, as the values in this image should be summed up to 5000 (right?).
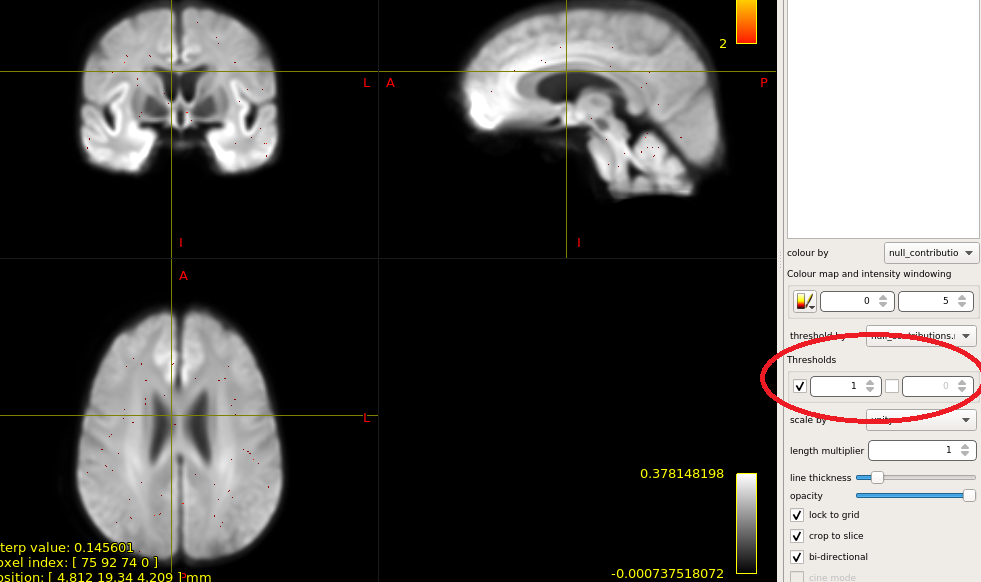 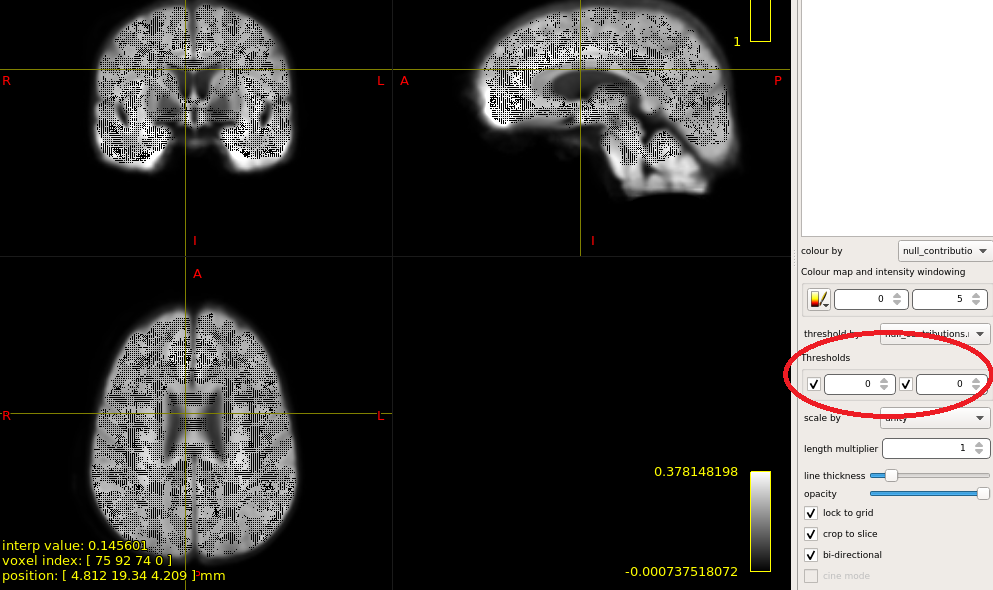
Is this normal? If it is not, what could be the problem? My B values are 0 and 1000. I followed the pipeline [here](http://userdocs.mrtrix.org/en/latest/fixel_based_analysis/mt_fibre_density_cross-section.html), and used _tck2fixel_ to filter out the fixels have fewer than 5 streamlines. This is the command I used in the final statistics.
`fixelcfestats fc_smooth/ fcfiles.txt design.txt contrast.txt matrix/ output_stats/ -nthreads 10 -mask fixel_mask/streamlinecount5.mif`
My design matrix are 3 columns: 1s, one covariate and one variable of interest, and my contrast is 0 0 1.
I would appreciate any of your suggestion!
---
### Author:  [@rsmith](https://community.mrtrix.org/u/rsmith)
#### Post date: [March 16, 2021, 5:42am UTC](https://community.mrtrix.org/t/how-to-improve-the-fba-results/4453/9 "2021-03-16T05:42:50Z")
> Am I right that you mean the value in each voxel of the “null\_contributions.mif” image represent the number of times that this voxel contribute to the maximal statistic across the brain during each shuffling?
Correct.
**Edit** : Well, almost. It’s the number of times that it contributed across _all_ shuffling; for _each_ shuffling, only _one_ fixel contributes, and for that individual shuffle, the value of that fixel in this particular image is incremented by one.
> My problem is that when I checked my “null\_contributions.mif” image, the values are from 0 to 5. But most of the values are 0 (see below).
That’s a good thing. In the ideal scenario, those contributions are scattered homogeneously across the fixel template. But if you have hundreds of thousands of fixels, and 5,000 permutations, then by design most fixels will have a value of zero.
> I think it is incorrect, as the values in this image should be summed up to 5000 (right?).
The second half is correct; but you don’t appear to have shown the process of quantifying that sum? The values that are used to determine the initial upper and lower bounds of the colour scaling / thresholds are the minimal and maximal values across all fixels. The _sum across all fixels_ is a completely different quantity. Indeed it’s slightly trickier to access, because technically it’s the _integral_ of all intensities in the image, which in any other context would be a pretty useless parameter, hence why e.g. `mrstats` doesn’t quote it. But if you were to use `mrstats` to get the _mean value_ of this image, and then multiply that by the fixel _count_, you should get 5,000.