We are working on some diffusion data using tracktify, and building a connectivity matrix using a 200 parcel atlas (schaefer). We’re relatively new to these pipelines.
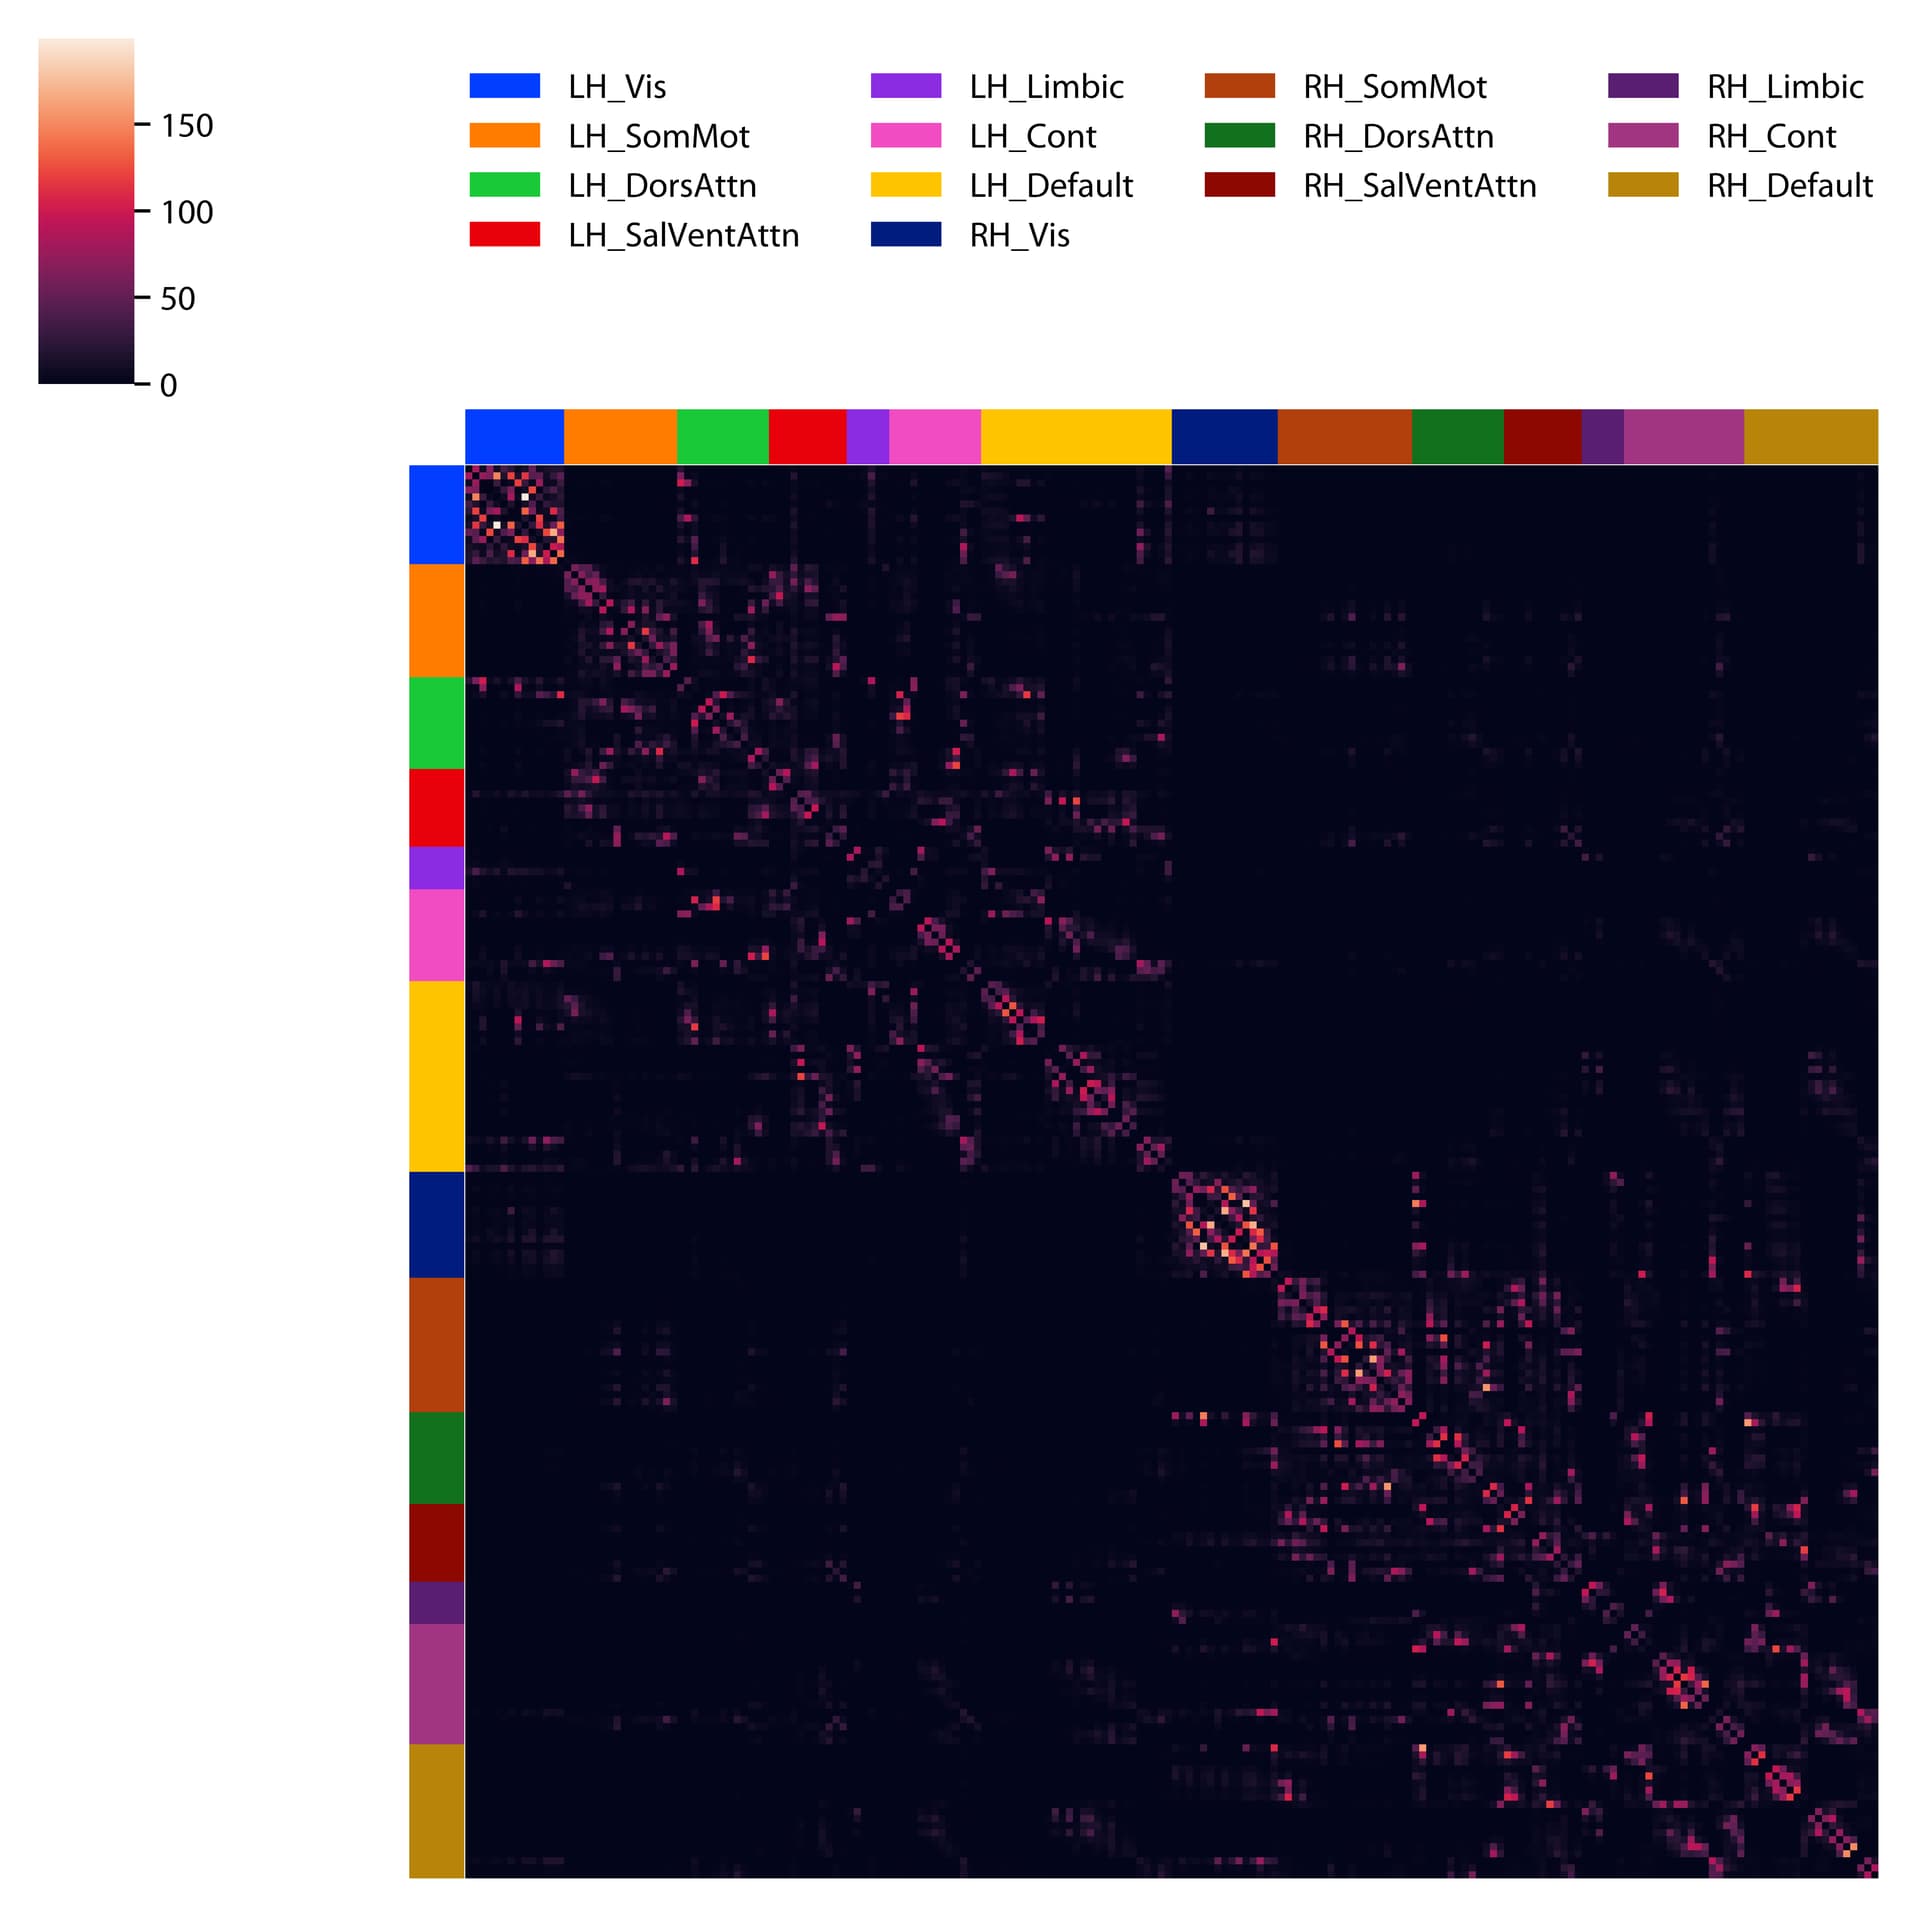
We are finding that we don’t get very many interhemispheric connections, almost everything is the on the same side.
Here’s what out matrix looks like, its divided right-left as top-bottom half, and sorted by networks.
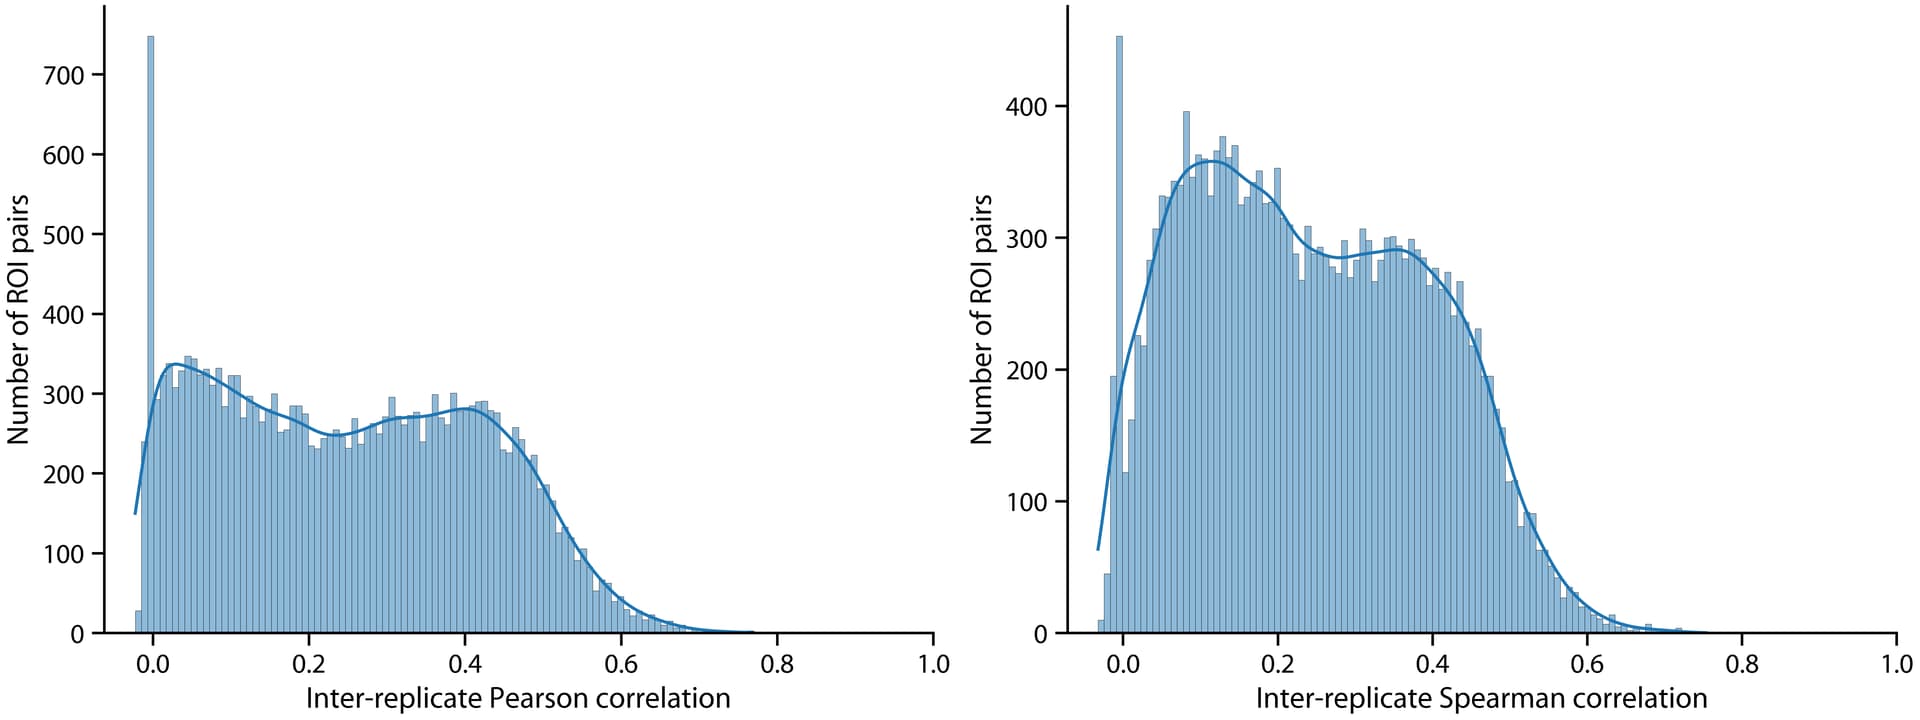
We’ve also been looking at scan-rescan reliability and it appears to be pretty poor, like correlation of 0.4 and below for most edges; here’s a histogram of the correlations or tractify outputs for each connection on scan-rescan (its probably under estimating because its longitudinal).
We have found similar effects in a second data set, i.e. poor scan-rescan and no cross-hemisphere.
Our pipeline is below for reference.
Advice appreciated on
1) why we don’t see cross hemispheric connections
2) if this replicability seems worse than expected
3) if there is maybe soemthing in the pipeline below we could make better in some way?
Pipeline:
Atlas: Schaefer2018_200Parcels_7Networks_order_FSLMNI152_2mm_flirt.nii.gz

Template: MNI152_T1_2mm_brain.nii.gz

## Extracting SSE from b1000s

# Extract b0s and b1000s from dwi

dwiextract --export_grad_fsl dwi_b1000.new_bvecs dwi_b1000.new_bval -fslgrad <bvecs> <bval> -shell 0.0,1000.0 <dwi.nii.gz> dwi_b1000.nii.gz

# Skullstrip the b1000s using bet

bet dwi_b1000.nii.gz dwi_b1000_brain.nii.gz -f 0.50 -m -R

# Get sse from eddy b1000s using dtifit

dtifit -k dwi_b1000.nii.gz -o dtifit_ -m dwi_b1000_brain.nii.gz -r dwi_b1000.new_bvecs -b dwi_b1000.new_bval --save_tensor --sse

## B0s

# Extract the b0s from the dwi

dwiextract -bzero --export_grad_fsl dwi_b0.new_bvecs dwi_b0.new_bval -fslgrad <bvecs> <bval> <dwi.nii.gz> dwi_b0.nii.gz

# Average out the b0s

mrmath -axis 3 dwi_b0.nii.gz mean dwi_b0_avg.nii.gz

# Skullstrip the average b0s using bet

bet dwi_b0_avg.nii.gz dwi_b0_avg_brain.nii.gz -f 0.50 -m -R

## Gray white matter interface

# Generate the five-tissue-type image (5TT) using freesurfer data

5ttgen freesurfer -nocrop <aseg.mgz> 5TT.mif

# Convert the 5TT to gray white matter interface to seed streamlines from

5tt2gmwmi 5TT.mif gmwmi.mif

## Registering atlas to diffusion space

# Register the T1 to diffusion space (t1_flirt)

flirt -in T1_brain.nii.gz -ref dwi_b0_avg_brain.nii.gz -out T1_to_dwi.nii.gz -omat T1_to_dwi.mat -dof 6

# Register the T1 to the template (pre_atlas_flirt)

flirt -in T1_brain.nii.gz -ref <template> -out T1_to_template.nii.gz -omat T1_to_template.mat

# Invert the matrix to get template->T1 matrix

convert_xfm -omat template_to_T1.mat -inverse T1_to_template.mat

# Concatenate the template->T1 and T1->diffusion to get template->diffusion matrix

convert_xfm -omat template_to_dwi.mat -concat T1_to_dwi.mat template_to_T1.mat

# Use the MNI->diffusion matrix to register the atlas to diffusion space (atlas flirt)

flirt -in <atlas.nii.gz> -ref T1_to_dwi.nii.gz -out atlas_to_dwi.nii.gz -omat atlas_to_dwi.mat -applyxfm -init template_to_dwi.mat -interp nearestneighbour

## Getting tracts and filtering

# Generate response function using the multishell 5tt algorithm

dwi2response msmt_5tt -fslgrad <bvecs> <bval> -mask dwi_b0_avg_brain_mask.nii.gz dwi.nii.gz 5TT.mif wm.txt gm.txt csf.txt

# Estimate the fibre orientation distributions (FOD) from the dwi

dwi2fod msmt_csd dwi.nii.gz wm.txt -fslgrad <bvecs> <bval> -mask dwi_b0_avg_brain_mask.nii.gz FOD.mif gm.txt gm.mif csf.txt csf.mif

# Generate tracts from gray white matter interface

tckgen -act 5TT.mif -algorithm iFOD2 -samples 4 -output_seeds out_seeds.nii.gz -seed_gmwmi gmwmi.mif -select 1000000 FOD.mif tracked.tck

# Filter the tracts to match the FOD lobe integrals

tcksift2 tracked.tck FOD.mif prob_weights.txt

## Generating connectivity matrices and outputs

# Generate the connectivity matrix scaled by length

tck2connectome -tck_weights_in prob_weights.txt -keep_unassigned -scale_invnodevol -scale_length -assignment_radial_search 4.000000 -symmetric -zero_diagonal tracked.tck atlas_to_dwi.nii.gz conmat_length_invnodevol.csv

## Other outputs

# Convert the 5TT for output

mrconvert 5TT.mif 5TT.nii.gz

# Convert the gray white matter interface for output

mrconvert gmwmi.mif gmwmi.nii.gz