Beginner here. I need to do a a group analysis (comparison of patients vs control). However, none of the tutorials I’ve encountered guides you to this type of analysis. Any advice or guidance (or link to a tutorial) will be welcome. Thank you. Oren
Dear @polivaoren ,
The easiest way is to follow the FBA pipeline (single or multi-tissue depending on your data) and at the statistical analysis step (step 23 or 24) perform a two-group unpaired t-test for a simple comparison of your groups. This will tell you whether there is a difference between your groups on either FD, FC or FDC within any fixel of the brain.
If you have any specific queries along the way, feel free to ask here.
Nick
Dear @NicDC ,
Hi, I am also new to the DTI world. And I would like to perform a study of healthy controls and patients regarding kurtosis. I have the DTI images focused for kurtosis analysis but I can’t find a pipeline to perform the processing. Do you have knowledge of any pipeline I can follow.
Juan.
Hello @Juan_Quizhpilema ,
I haven’t done kurtosis imaging myself, and from previous posts on the forum, it looks like there might be better equipped packages to perform this. Check out PyDesigner for instance.
All the best,
Nick
Thank you for the explanation. I’m looking at step 23 and it asks me to provide a files.txt , design_matrix.txt and contrast_matrix.txt files. However, the tutorial doesn’t provide an example of how these files should look like. Can you explain to me how these files should look like (or provide me with examples). That will be extremely helpful. Thank you
No worries…
Files.txt is just a list of your participant ID/label as contained in the fixel directory, one per line so something like:
sub-CON01
sub-CON02
sub-CON03
sub-PAT01
sub-PAT02
sub-PAT03
design_matrix.txt should contain your independent variables in separate columns. For a two group unpaired t-test you would have two variables, one for each group - make sure each line corresponds to the ID order in Files.txt
1 0
1 0
1 0
0 1
0 1
0 1
contrast_matrix.txt is the specific contrast you want to compare - in the two group situation you can investigate if patients have lower values than controls like this (difference between the two explanatory variables in your design matrix). The number of columns here has to correspond to your design matrix.
1 -1
Cheers,
Nick
1 Like
Thanks for your recommendation, I will try PyDesigner for kurtossis. And another program for statistical analysis between groups with tractography? To get the map of FA, MD, AD, RD. I have tried programs with Dipy, Mrtrix3 but I can’t find a pipeline that will lead me to obtain these maps within a group analysis.
Thanks for your help
Dear @NicDC:
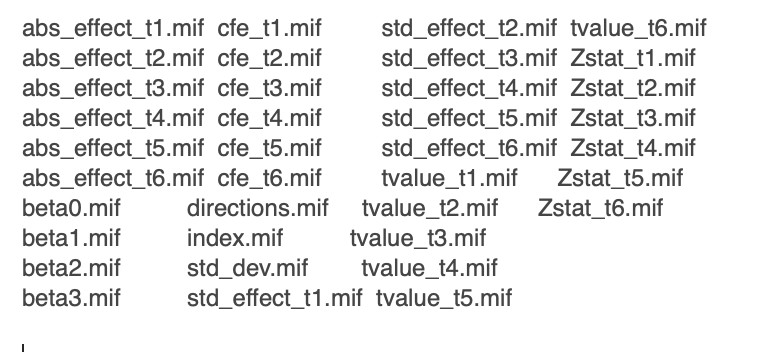
hello. I am a green hand to use FBA, too. and I met a question about the statistical commond “fixelcfestats”. I succeed to get the output the “fixelcfestats”, but I do not the meaning of each mif file. my output just look like this as below, I try to read to official document to understand the output of “fixelcfestats”, but still confused.
could you give me any help?
thanks a lot
suming
-----------------------this is my output of fixelcfestats---------------------------
Hello,
It is difficult to know exactly what these mean without seeing the design and contrast matrices.
I’m assuming you have 4 columns in your design matrix, and their betas are represented by beta0-3. If you performed six contrasts, the corresponding statistical maps (tvalue, Zstat, abs_effect, std_effect, cfe, fwe_pvalue, uncorrected_pvalue) per contrast are output.
To evaluate the probability of a significant contrast, corrected for family-wise error rate, you need to look at the fwe_pvalue map which contains (1-p) values. In your case here, it seems like the command does not perform the statistical inference required to get the probability values. Unless you passed the -notest flag, you will need to check why the permutations did not run.
Cheers,
Nick
1 Like
Generally speaking, once you have performed tractography, you can sample any metric (FA, MD, AD, RD) along your tracks of interest and then compare these values between groups. There are several posts on the forum about how to perform these steps.
All the best,
Nick
Hello. I have a follow up question. You said that cfe.mif is the file we need to evaluate significance. When I open this file in mrview, I get coloring by cfe.mif (range of 0 to 588) but thresholding by zstat.mif. Do I need to change the thresholding to cfe.mif? Under ‘Thresholds’, do I need to change the number to 0.95 (to signify <0.05) or to 588*0.95? or do I stick to the pre-assigned default (-2.67)? Also, how is the cfe file different than the fwe file?
Hey,
I was wrong - the cfe values are not what you want to look at, but the fwe_pvalue values. The cfe map is the enhanced statistical map based on the connectivity between fixels, and inference is performed on the likelihood of these values exceeding the permuted value.
If you load the fwe_pvalue map your can threshold at 0.95 to look at fixels with a type 1 error rate below 0.05.
Sorry for the confusion ![]()
Nick