I have the 5tt file generated, all my tissue files are normalised between 0 and 1, but the sum in all brain voxels is not 1, I can easily normalize this, but I was wondering what would be the effect in the ACT tractography. Thanks in advance.
I presume from the way you have phrased your comment that you are generating a 5TT file through a mechanism other than 5ttgen?
… all my tissue files are normalised between 0 and 1, but the sum in all brain voxels is not 1 …
Even if the values within each individual volume are constrained to lie between 0 and 1 inclusive, I wouldn’t refer to this as “normalised”, as it may lead to confusion. “Scaled” would be a more appropriate term. To “normalise” in this sort of context should refer specifically to giving something a unit norm (L1 norm in this case).
… but I was wondering what would be the effect in the ACT tractography.
If the sum of partial volume fractions is less than 0.5, the point is considered “outside the brain”.
For a point inside the brain, the tissue type with the greatest partial volume fraction is selected as the tissue at that point.
So this should actually be fairly robust to 5TT images where the volumes don’t perfectly sum to 1, as long as that sum is greater than 0.5 for brain voxels. Having said that, normalising still feels like a pretty sensible thing to do anyway…
I was re-checking my data, and I found that the sum of all the partial volumes inside the brain is bigger than 0.5. But I also notice that there are a lot of voxels were the sum of the PVE effects is bigger than 1. I did the tractography with this 5tt file (including the gmwmi generation) and I repeated with the same 5tt but now correctly scaled. I don’t se any difference between both. Should I be worried about that?
At some point I intentionally made modifications to the internal checks made by ACT to be more robust against such cases.
For instance: To determine when a streamline has entered cortical GM, the manuscript states that the code checks for P_CGM >= 0.5. In the current implementation however, I instead test: (P_CGM + P_SGM > max(P_WM, P_CSF, P_PATH); that is, “grey matter” is the most dense tissue at this location. If it is, I then check to see if P_CGM > P_SGM; that is, there’s more “cortical” grey matter than “sub-cortical” grey matter. By checking relative rather than absolute tissue fractions, the logic becomes more robust against such variations in input; with the exception of if the total sum of partial volume fractions drops below 0.5, which is a hard constraint by necessity.
So while it doesn’t surprise me at all that you don’t see any major differences in the tracking results, it’s nevertheless worth thinking carefully about why the tissue partial volume fractions don’t sum to 1 in the results of whatever pre-processing you’re doing, since that doesn’t make physical sense; as well as what justification there would be for not normalising those fractions if you have no control over generation of those data.
Not sure if this is the case here, but a scenario that comes to mind would be where the 5TT image is at some point resampled (for whatever reason). If this would be done with any interpolation other than nearest neighbour or linear, I can see the sum of tissue fractions changing; probably most drastically around tissue interfaces. If this is the case, a quick look at the actual sum-of-5TT map should reveal this. @mblesac, even in general, it may help if you show a screenshot of the sum-of-5TT map. Whatever pattern (if any) it presents, may potentially be helpful to reveal what’s exactly going on (and how bad, or not, it is).
It’s worth noting that in e.g. tcksift, when the 5TT image is “re-gridded” to diffusion image space, this is not just an image interpolation: It’s drawing a grid of points within the space of each voxel, and counting the number of those points that correspond to each tissue type based on trilinear interpolation of the input 5TT image at each point; this prevents blurring, as well as the effect you describe. If this is indeed what has been done, I could add a 5ttregrid command to the repository, which performs just this step… @mblesac?
Currently I have this tissue segmentations (TPM) involved in two projects.
For the first one, I used only ACT and the sum of the TPM were not scaled between [0 1]. To be sure, I repeated the analysis in a sub-cohort of the study with the scaled TPM and there were not visually differences in the tractography and neither were statistically significant differences in the connectivity matrices (including self-connections).
In the second study I used ACT+SIFT and for this one, I used the scaled TPM.
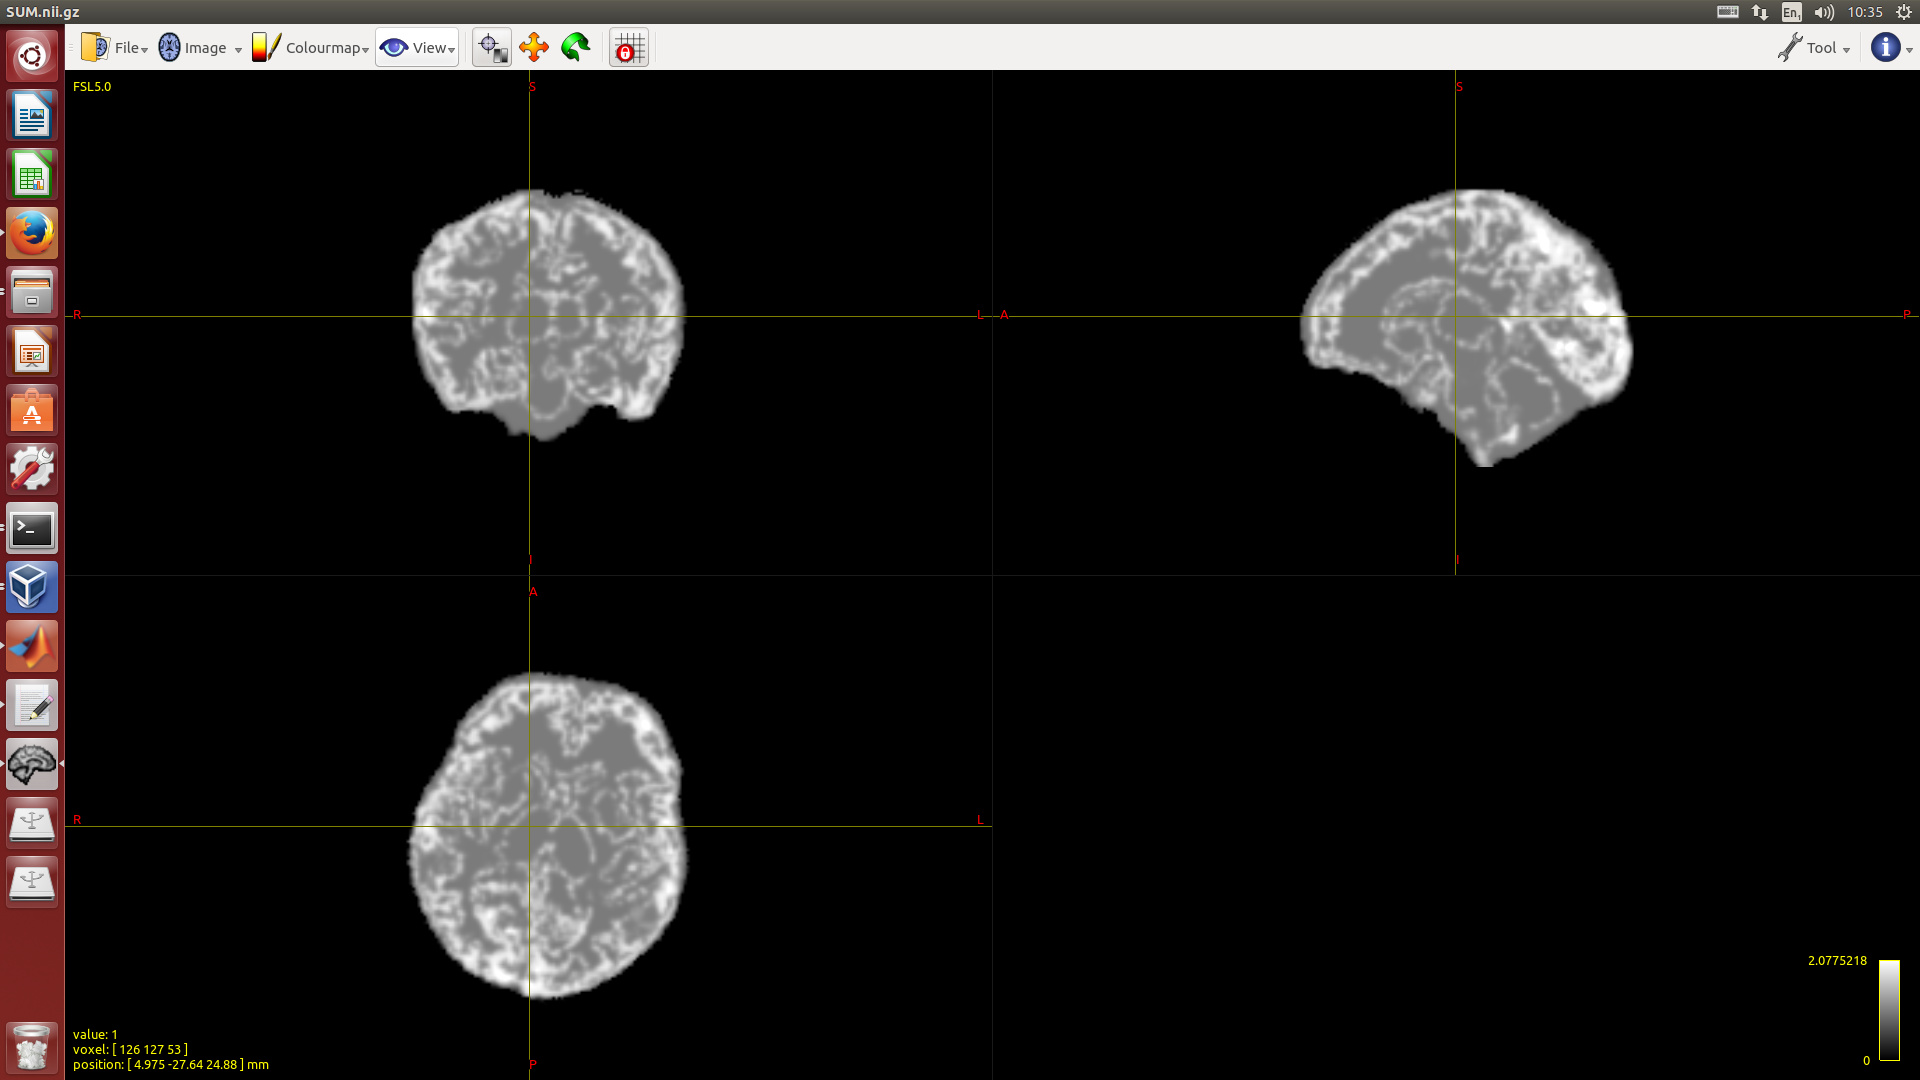
Attached is one screen-shot of the sum of the non scaled 5TT. I could send you also the 5TT of one subject if you are interested.
Ok, that does seem to be the tissue interfaces (or in general, areas where you’d expect mixtures) standing out. Judging from the colour bar, I reckon all the grey areas nicely sum to (very close to) one, due to probably just a single tissue type being present. What does stump be a bit is the value for those mixtures: the colour bar tells us they reach values up to 2… that’s quite extreme, and goes beyond what I’d realistically expect to happen if e.g. a correct 5TT image (summing to one) is resampled once using cubic or even sinc interpolation (unless I’m misjudging things).
@mblesac, I second @rsmith’s original request here: can you tell us what process the 5TT image was actually obtained from, and what it has potentially subsequently gone through? The 5ttgen script, as far as I’ve experienced, always produces 5TT images that nicely sum to one… so the 5TT image you’re presenting here must’ve either been obtained in a different way, or has gone through some other steps before ending up like this. That, or there is some unexpected behaviour that we / @rsmith would probably be interested in fixing. Just sending us the 5TT image will probably not help much (we can see from the screenshot what the situation is quite clearly); we’re rather wondering how it ended up being that way.
I’m working with neonatal data, so the 5ttgen script doesn’t work. So I used another method (https://www.ncbi.nlm.nih.gov/pmc/articles/PMC5247463/) and the TPM are good, and all of them scaled between 0 and 1. The problem is the sum in some areas (in all the brain, the sum of partial volumes is bigger than 0.5), I guess that is because the different tissues are tested independently.
Thanks for the prompt reply @mblesac! I think these facts explain the scenario quite clearly. Getting your tissue segmentations from another method like that, I reckon the safest way to proceed is to indeed normalise them manually to sum to 1.
But working with neonatal data, these bits will probably be the least of your worries… The interpretation of CSD, and hence apparent fibre density (FD) can get very tricky in such scenarios. I noticed you mentioned SIFT earlier on as well… you may want to be careful with the interpretation of such methods on neonatal data in particular.
I’m working with neonatal data, so the 5ttgen script doesn’t work.
Specifically the 5ttgen fslalgorithm doesn’t work. I’ll now proceed to shout into my own echo chamber on the off chance that it interests someone:
The 5ttgen script provides a common interface for “generating a 5TT image”. There are then a range of algorithms that can be invoked to perform that task: currently there’s only two (5ttgen fsl and 5ttgen freesurfer), but I hope that list will increase; dwi2response, in contrast, currently has six. If you have some competence with Python, you could modify a copy of one of these existing algorithms such that it instead invokes the tools / performs the conversions necessary to generate a 5TT image based on the software & methods you are using; if this is saved as a new .py file in the appropriate location alongside the existing algorithm files (lib/mrtrix3/_5ttgen/), then that new algorithm with be automatically detected by 5ttgen, and made available through the 5ttgen script interface.
That then forms a great mechanism for you to contribute to MRtrix3 and hence distribute your method for community use
You can’t blame our active dwi2response community though, it’s a much more fun problem to play around with than whole brain 5TT segmentation.
But the problem here is mostly that whole brain 5TT segmentation (i.e. for all voxels) is bound to be “easier” and has traditionally more applications based on anatomical (e.g. T1w) images. If we want to reach out to those people, we might have to reach beyond our “own” dMRI community. Also, with our preferred applications for such a 5TT segmentation in mind (first and foremost that would be ACT), the qualities we care about in such a 5TT segmentation may be different to those people that study anatomical images care about. For them misclassifying a voxel is most of the time just that; a single voxel. For us, it may matter much more where that voxel happens to be misclassified (e.g. a false positive gray matter voxel right in the middle of white matter is relatively speaking more annoying than elsewhere, in an ACT context).