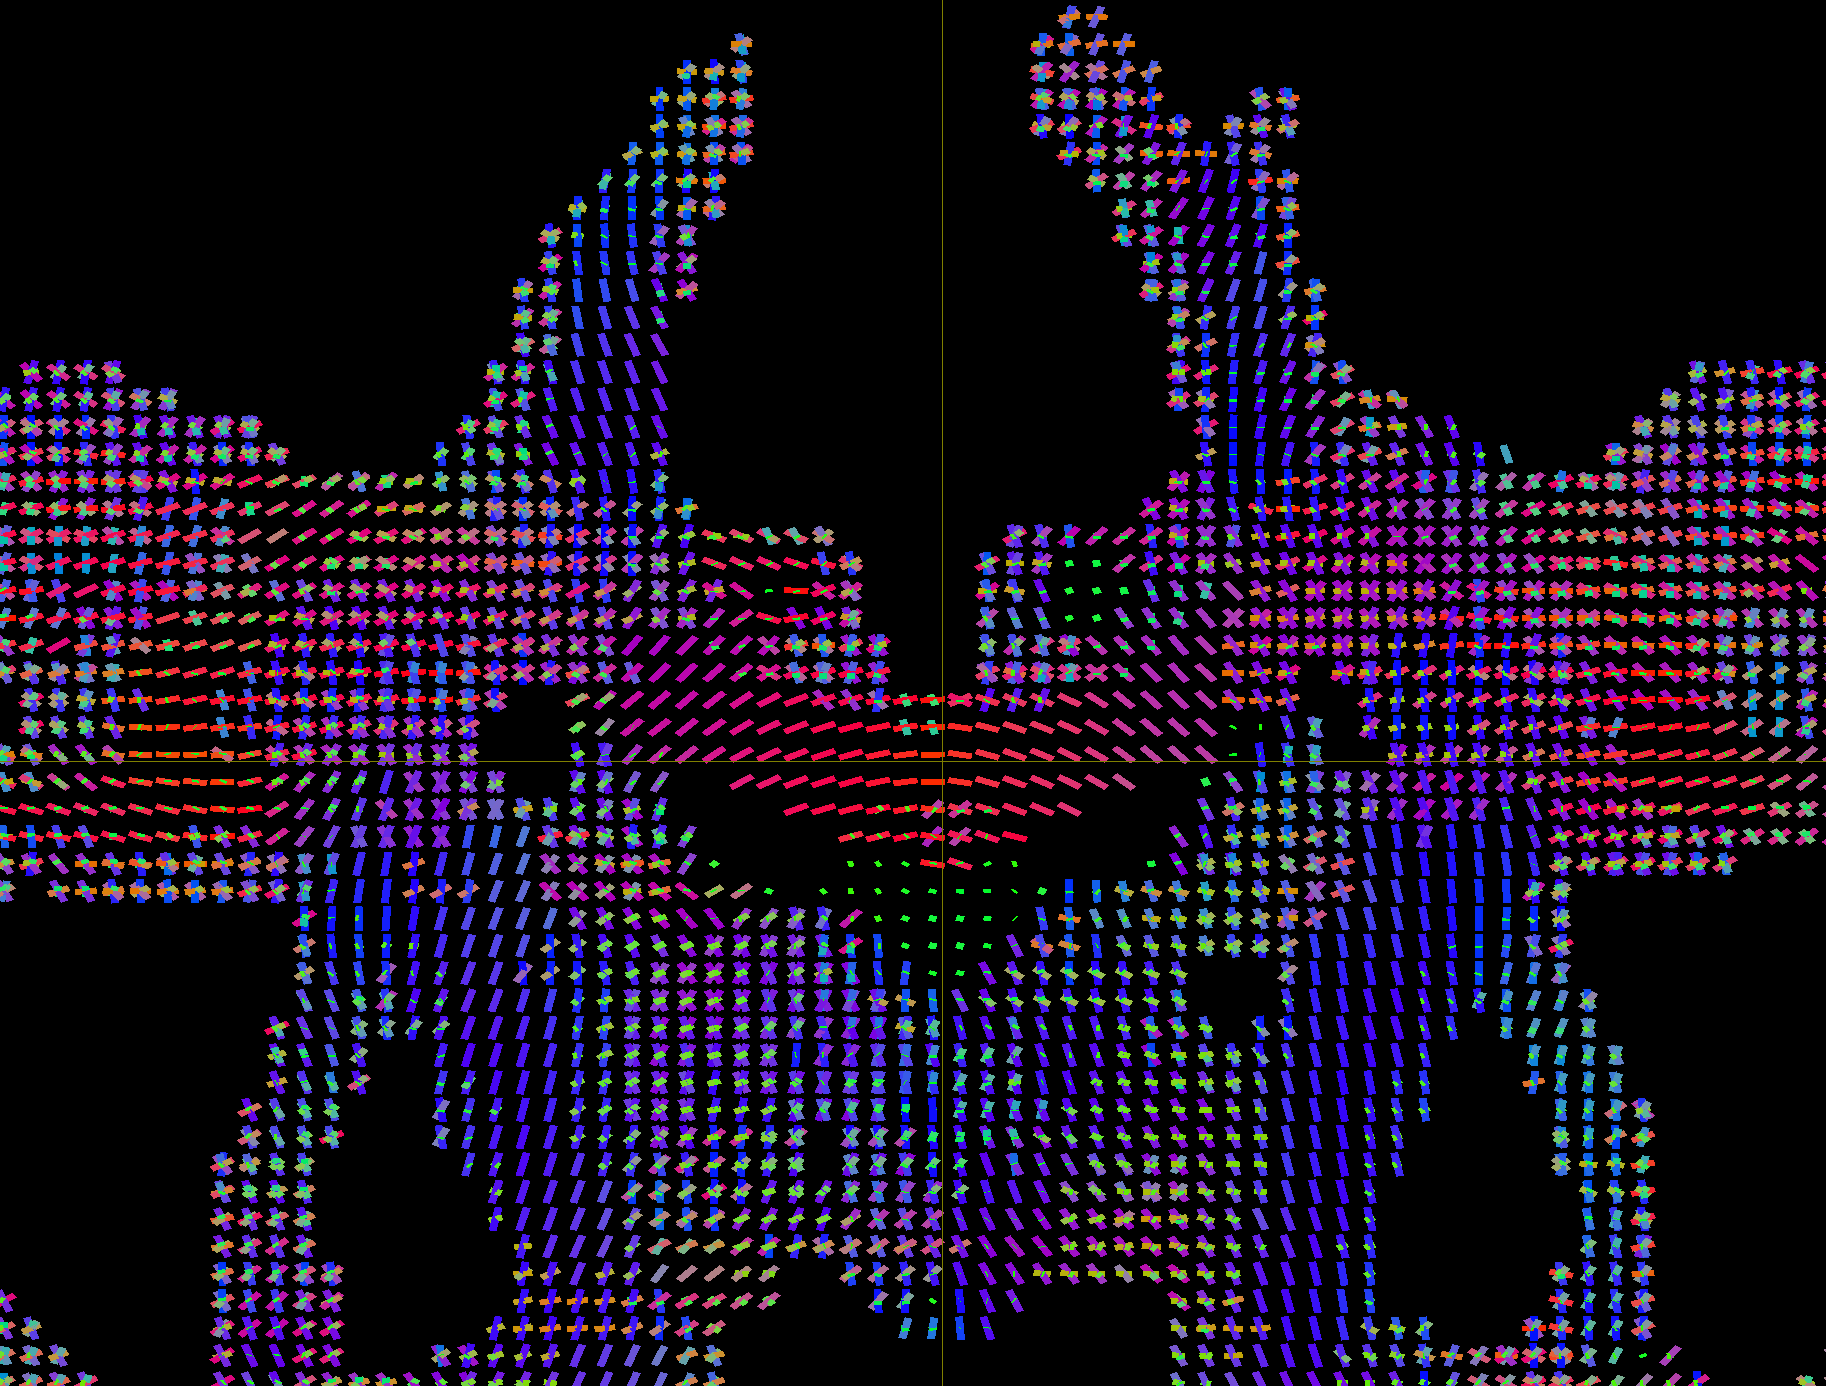
Hi, I am hoping to generate a directional element image like the fixel map below, but as a 3D image that could be converted to jpeg for QC/screening purposes. My goal is to create a fast way of screening for incorrectly oriented principle eigenvalues like the one below (coronal slice, orientation errors–particularly obvious in callosal fiber). In this example, eyeballing the DEC maps doesn’t work, since the error is rotated 180 degrees and therefore shows the “correct” color encoding in dec maps. Maybe there is an even simpler way to do this, in which case I’m all ears. Thanks in advance for any advice/guidance!
Hi Rachael,
Take a look at this script: https://github.com/MRtrix3/mrtrix3/blob/master/bin/dwigradcheck
…if you’re looking to screen for flipped gradient directions (which are often the cause of those flipped eigenvalues or fixels).
If it’s really more about the eigenvalues or fixels themselves (e.g. you want to check whether the processing pipeline didn’t introduce such flips), note that you don’t need a full 3D image. 2 well chosen slices are sufficient: one good coronal one, like the one you show, focusing on the correct diagonal orientation of some of those purple orientations (like the ones you descripe), and another good axial one, e.g. at the level of genu and/or splenium, focusing on the correct diagonal orientation of some of the “yellow” orientations. If you’ve checked orientations of “diagonal” structures that run close to in-plane of 2 independent perpendicular slices (e.g. coronal and axial), and they check out, then all is well as to flips; no further need to check the 3rd perpendicular plane (e.g. sagittal) at that stage.
Hope this helps,
Cheers,
Thijs
Thanks for this info, Thijs! I tried that script, and my output looks like this (truncated at 25 lines for brevity’s sake; there were 49 lines overall):
Mean length     Axis flipped    Axis permutations    Axis basis
47.75            2                (0, 1, 2)           image
47.23            2                (0, 1, 2)           scanner
27.82            0                (0, 1, 2)           image
27.63            0                (0, 1, 2)           scanner
26.33         none                (0, 1, 2)           scanner
26.10            1                (0, 2, 1)           scanner
26.00         none                (0, 1, 2)           image
25.78            2                (2, 1, 0)           scanner
25.58            2                (0, 2, 1)           image
25.51            2                (2, 1, 0)           image
25.35            0                (2, 1, 0)           image
24.91            1                (0, 1, 2)           image
24.88            2                (1, 0, 2)           scanner
24.82            0                (2, 1, 0)           scanner
24.55            1                (0, 1, 2)           scanner
24.30         none                (1, 0, 2)           scanner
24.26         none                (1, 0, 2)           image
24.11            2                (1, 0, 2)           image
23.77            1                (0, 2, 1)           image
23.52            2                (0, 2, 1)           scanner
22.65         none                (0, 2, 1)           image
22.48            0                (0, 2, 1)           scanner
21.83            0                (1, 0, 2)           image
21.66            0                (0, 2, 1)           image
From what documentation I could find (including the paper), I can tell that something is definitely amiss–but how to interpret the specifics? Which of these rows of output specifies a problem?
For what it’s worth, I nabbed the optimized bvec file generated from dwigradcheck and it seems to have fixed that orientation problem, which is thrilling. Can I trust the optimized result, or do I need to keep following up with the MR site that generated these data to try and figure out the source of the bad header in the first place? (I have about 150 acquisitions with this issue).
Regarding the following:
Since I have a load of data to check this way, and I have to do all my visualization locally (main data are stored in an HPC environment), I was hoping to generate a visual QC solution that would automatically grab key slices for easy summary-via-jpeg visual checking (in batches). I guess another way of asking what I’m asking is: is there a way to create a DEC image, but instead of just color, it displays a “fixel-like” directional representation of the primary eigenvalue? This might be a really dense question, and I just don’t know how to grab 2D slices from 4D fixel data.
Thanks much and let me know if I can clarify anything!
Rachael
P.S. I know this is related to a question that comes up here and there, which is the wish for a slicesdir-like command. I don’t mind cobbling together a code myself that is “slicesdir-like”, I’m more interested in how I might get from a 4d fixel slice like the one above, to a 2d image of a specific slice’s directional elements.
1 Like
First column is the average track length in mm given different combinations of gradient table axis flips (second column), gradient table axis permutations (third column), and gradient table axis bases (fourth column). The entries are sorted by mean track length (descending), so the top entry should be the correct one.
Clearly, the problem is that your third axis (indicated by nr 2 as we start counting from 0) has to be flipped. This means that you should multiply the complete third column of your gradient table with -1. The dwigradcheck also suggests that the gradient table should be interpreted as being specified in image coordinates instead of scanner coordinates. However, if you look at the mean lengths of the top 2 entries, they are actually almost identical. In fact, depending on how your image were acquired, the image and scanner coordinate system themselves could be identical (you have to inspect mrinfo output for that).
That is good news! I suspect that you can get away with just multiplying the third row of your gradient table with -1 for each of those 150 data sets. If you want to be sure, apply that fix for each data set and then run the dwigradcheck script for those 150 corrected data sets. The output should then always look as follows:
Mean length     Axis flipped    Axis permutations    Axis basis
<Number>               none               (0, 1, 2)           scanner
<Close Number>     none               (0, 1, 2)           image
with image and scanner coordinates possibly interchanging, but with very close mean track lengths (like in your example).
If image coordinates sometimes come up on top with clearly distinct mean track lengths, then probably you also have to convert each of your gradient tables from image to scanner coordinates. Let us know if that happens.
… the wish for a slicesdir-like command …
First requisite component for such is on its way…
I’m more interested in how I might get from a 4d fixel slice like the one above, to a 2d image of a specific slice’s directional elements.
There’s a bit of a jump in capability between simply grabbing a slice of image data and writing it to a 2D image, and drawing fixels. For the latter we would typically advise utilising mrview’s command-line options to generate the scene and grab a screenshot. Unfortunately this still isn’t possible on headless systems without adequate video drivers; but support for such would take a lot of work.