The data is single-shell (b1000) and with 32 directions, was denoised and eddy-corected beforehand and the command that I used is almost identical to the one in the video:
My first thought on seeing your results is that you’re probably using lmax 6 in the dwi2fod call (the default with your data). Trying setting it to -lmax 8, see if that helps.
Also consider using multi-tissue CSD if you’re not already – it can be used with ‘single-shell’ data, since the b=0 volumes constitute a ‘shell’ in their own right… See e.g. this thread for example.
What has changed since the above video’s occasion though, is the default -cutoff value, which is now lower (but also the evaluation of the FOD amplitudes in this context has been altered/fixed). This all together did result in an effectively lower -cutoff, which you should pay particular attention to for (single-tissue) CSD for sure. I agree with @rgrazioplene that an important starting point to fix up your result would be the -cutoff parameter; it clearly has to be increased for this dataset and FODs. When doing that, you’ll get rid of smaller noisy peaks that the streamlines shouldn’t embark along; but also, for the appropriate peaks, increasing the -cutoff inherently results in a smaller “angular cone” of amplitudes that the algorithm allows tracking for, so it’s also an indirect way of somewhat tweaking the allowed curvature. You can also further inherently tweak this via the -power option for iFOD2 (but that might require some experience with the algorithm), and more explicitly via the -angle option. Just make sure you’re still allowing for the curvature to track the main curve in this bundle.
That was merged into 3.0_RC1 – so assuming your installation is more recent than July 2017, you should be fine on that front. The -cutoff is indeed the more likely culprit – see our discussions on that front if you’re interested.
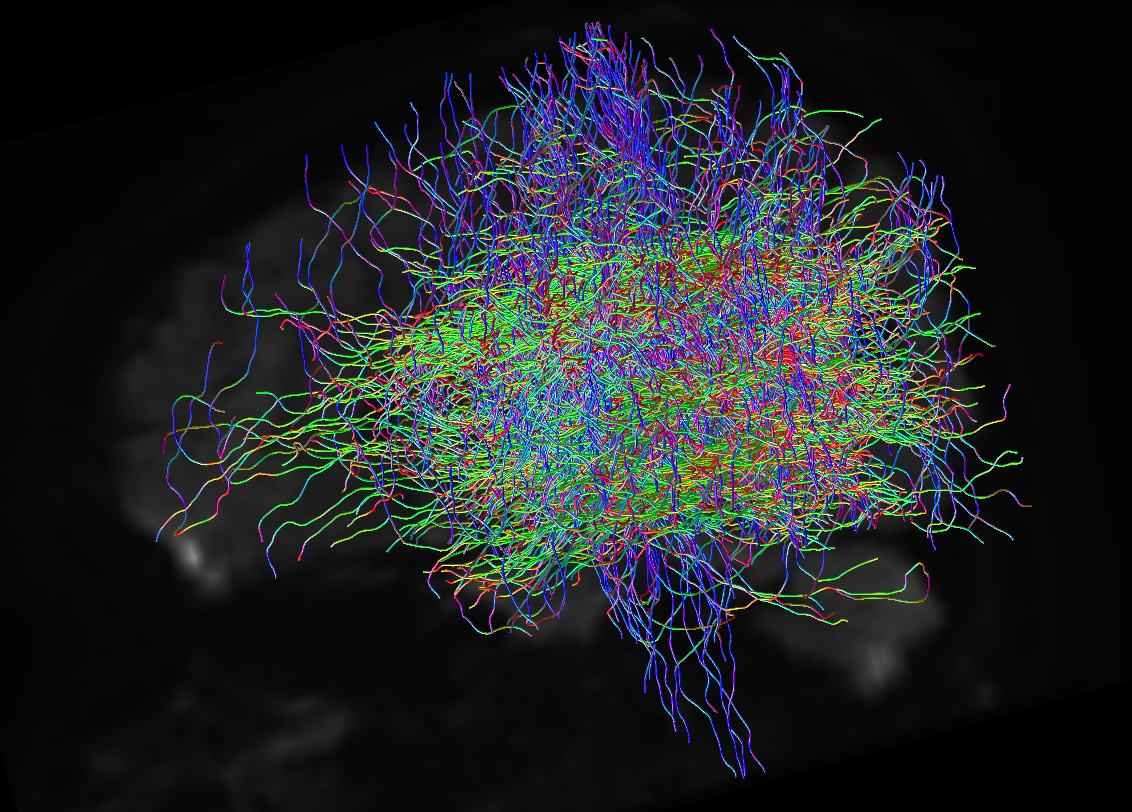
It’s important to distinguish between a reconstruction issue (e.g. erroneous tracks, very wavy tracks, etc.) and a visualisation issue (e.g. can’t see the structure of interest when streamlines are entirely opaque). The feedback above all relates to the former, which obviously takes precedence. However something like your first image can still conceivably be observed even with “appropriate” tracking, and is an inevitable consequence of rasterising 3D geometric data onto a finite 2D grid. E.g. If you have a very low resolution monitor, the issue will be far more pronounced, whereas if you have a very high resolution monitor / use something like multi-sampling anti-aliasing, the issue is reduced, as pixels from one streamline are less likely to obscure pixels of another streamline, and so the relative density of streamlines in different areas of the image becomes more apparent (you need to be able to see “empty space” in between streamlines). And there’s all sorts of tricks that can be done for visualisation, including the use of opacity (which is a “trick” in its own right). So, just wanted to be clear that the suggestions above are not a strict solution for the entirety of what you reported.