Right, but I use msmt_5tt algorithm for the response function estimation, which makes me think that the integrity of 5tt generation will impact virtually every consequent step of the process. Am I correct?
Sure. But those have additional degrees of separation between what’s going wrong with 5TT generation, how that might hypothetically affect response function estimation, then how that might hypothetically affect FOD estimation / global tracking. So there’s not a whole lot to be gained in looking at the outputs of dwi2fod / tckglobal, even if they are subjectively OK: For the sake of bug-squashing it’s best to focus on the 5TT generation step.
It looks to be in the correct format, with brain tissue sum equal 1 and the non-brain 0. However, I noticed that the subcortical structures (CP, thalamus) were considered “non-brain”, giving me a value of 0 in the deep brain regions.
That would be highly unusual… and a different result to what you first presented… But are you actually checking the sum of tissue volume fractions (i.e. mrmath 5TT.mif sum - -axis 3 | mrview -)?
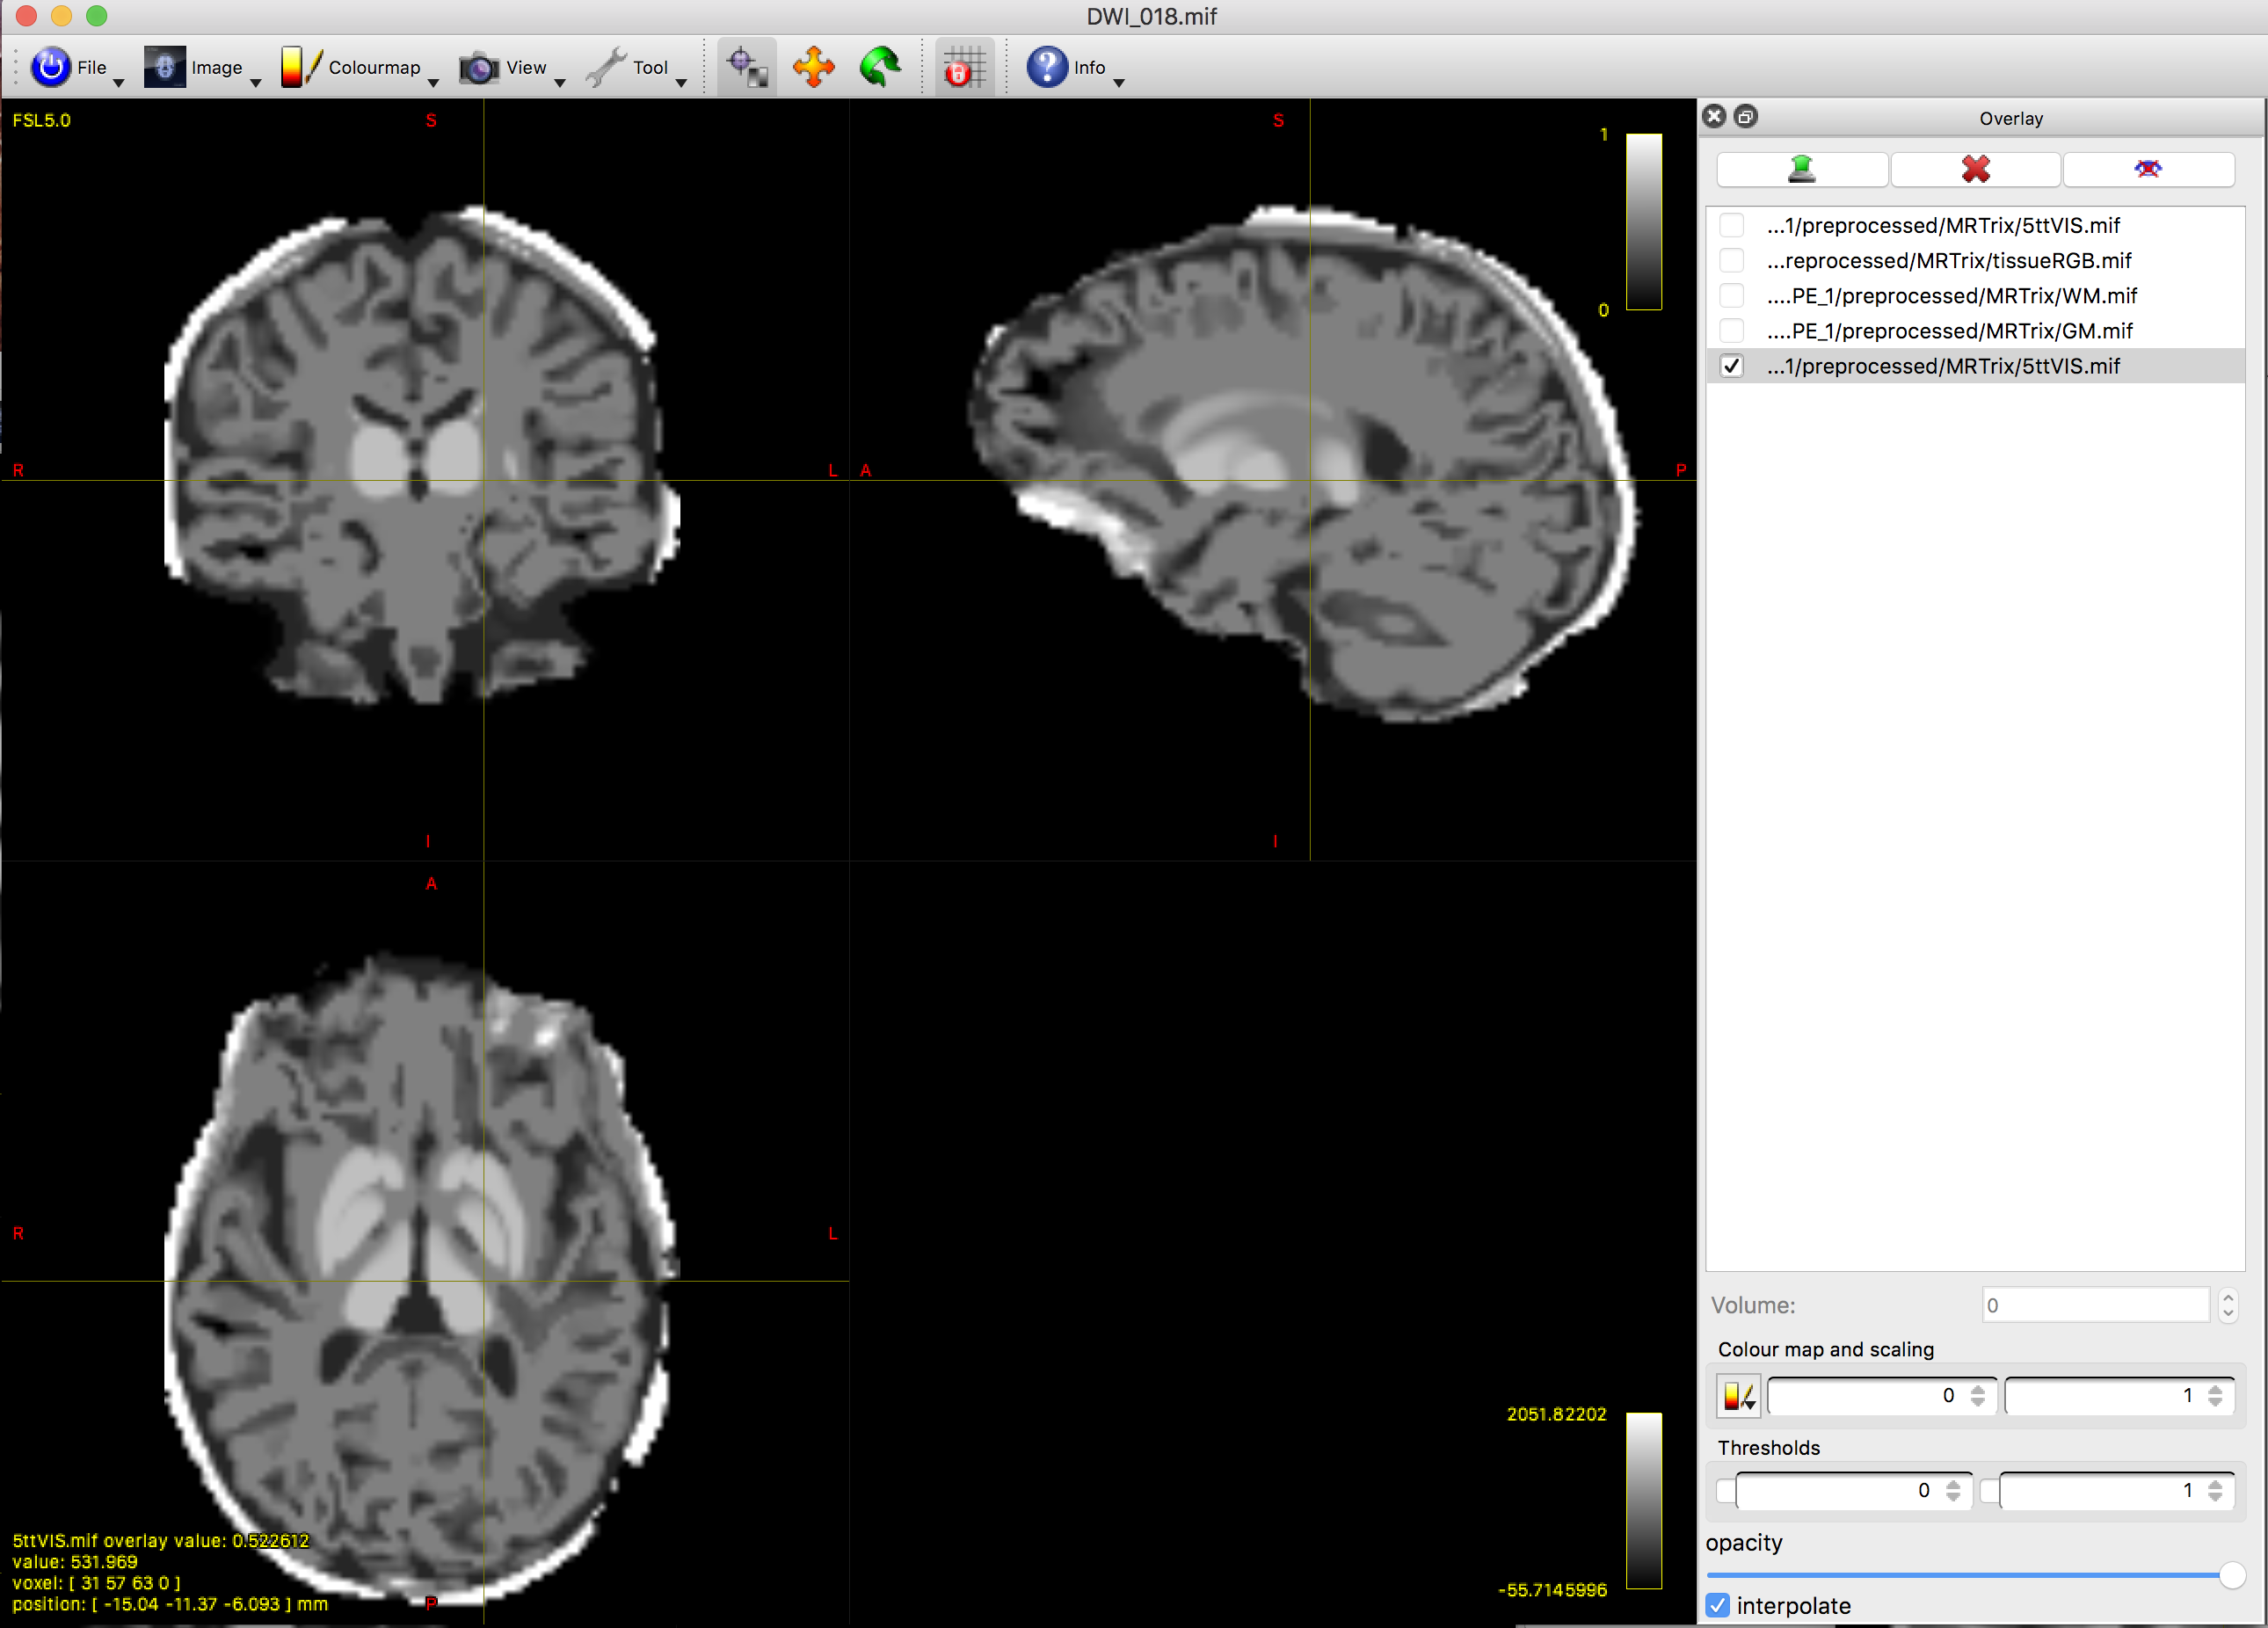
Here is the 5tt image:
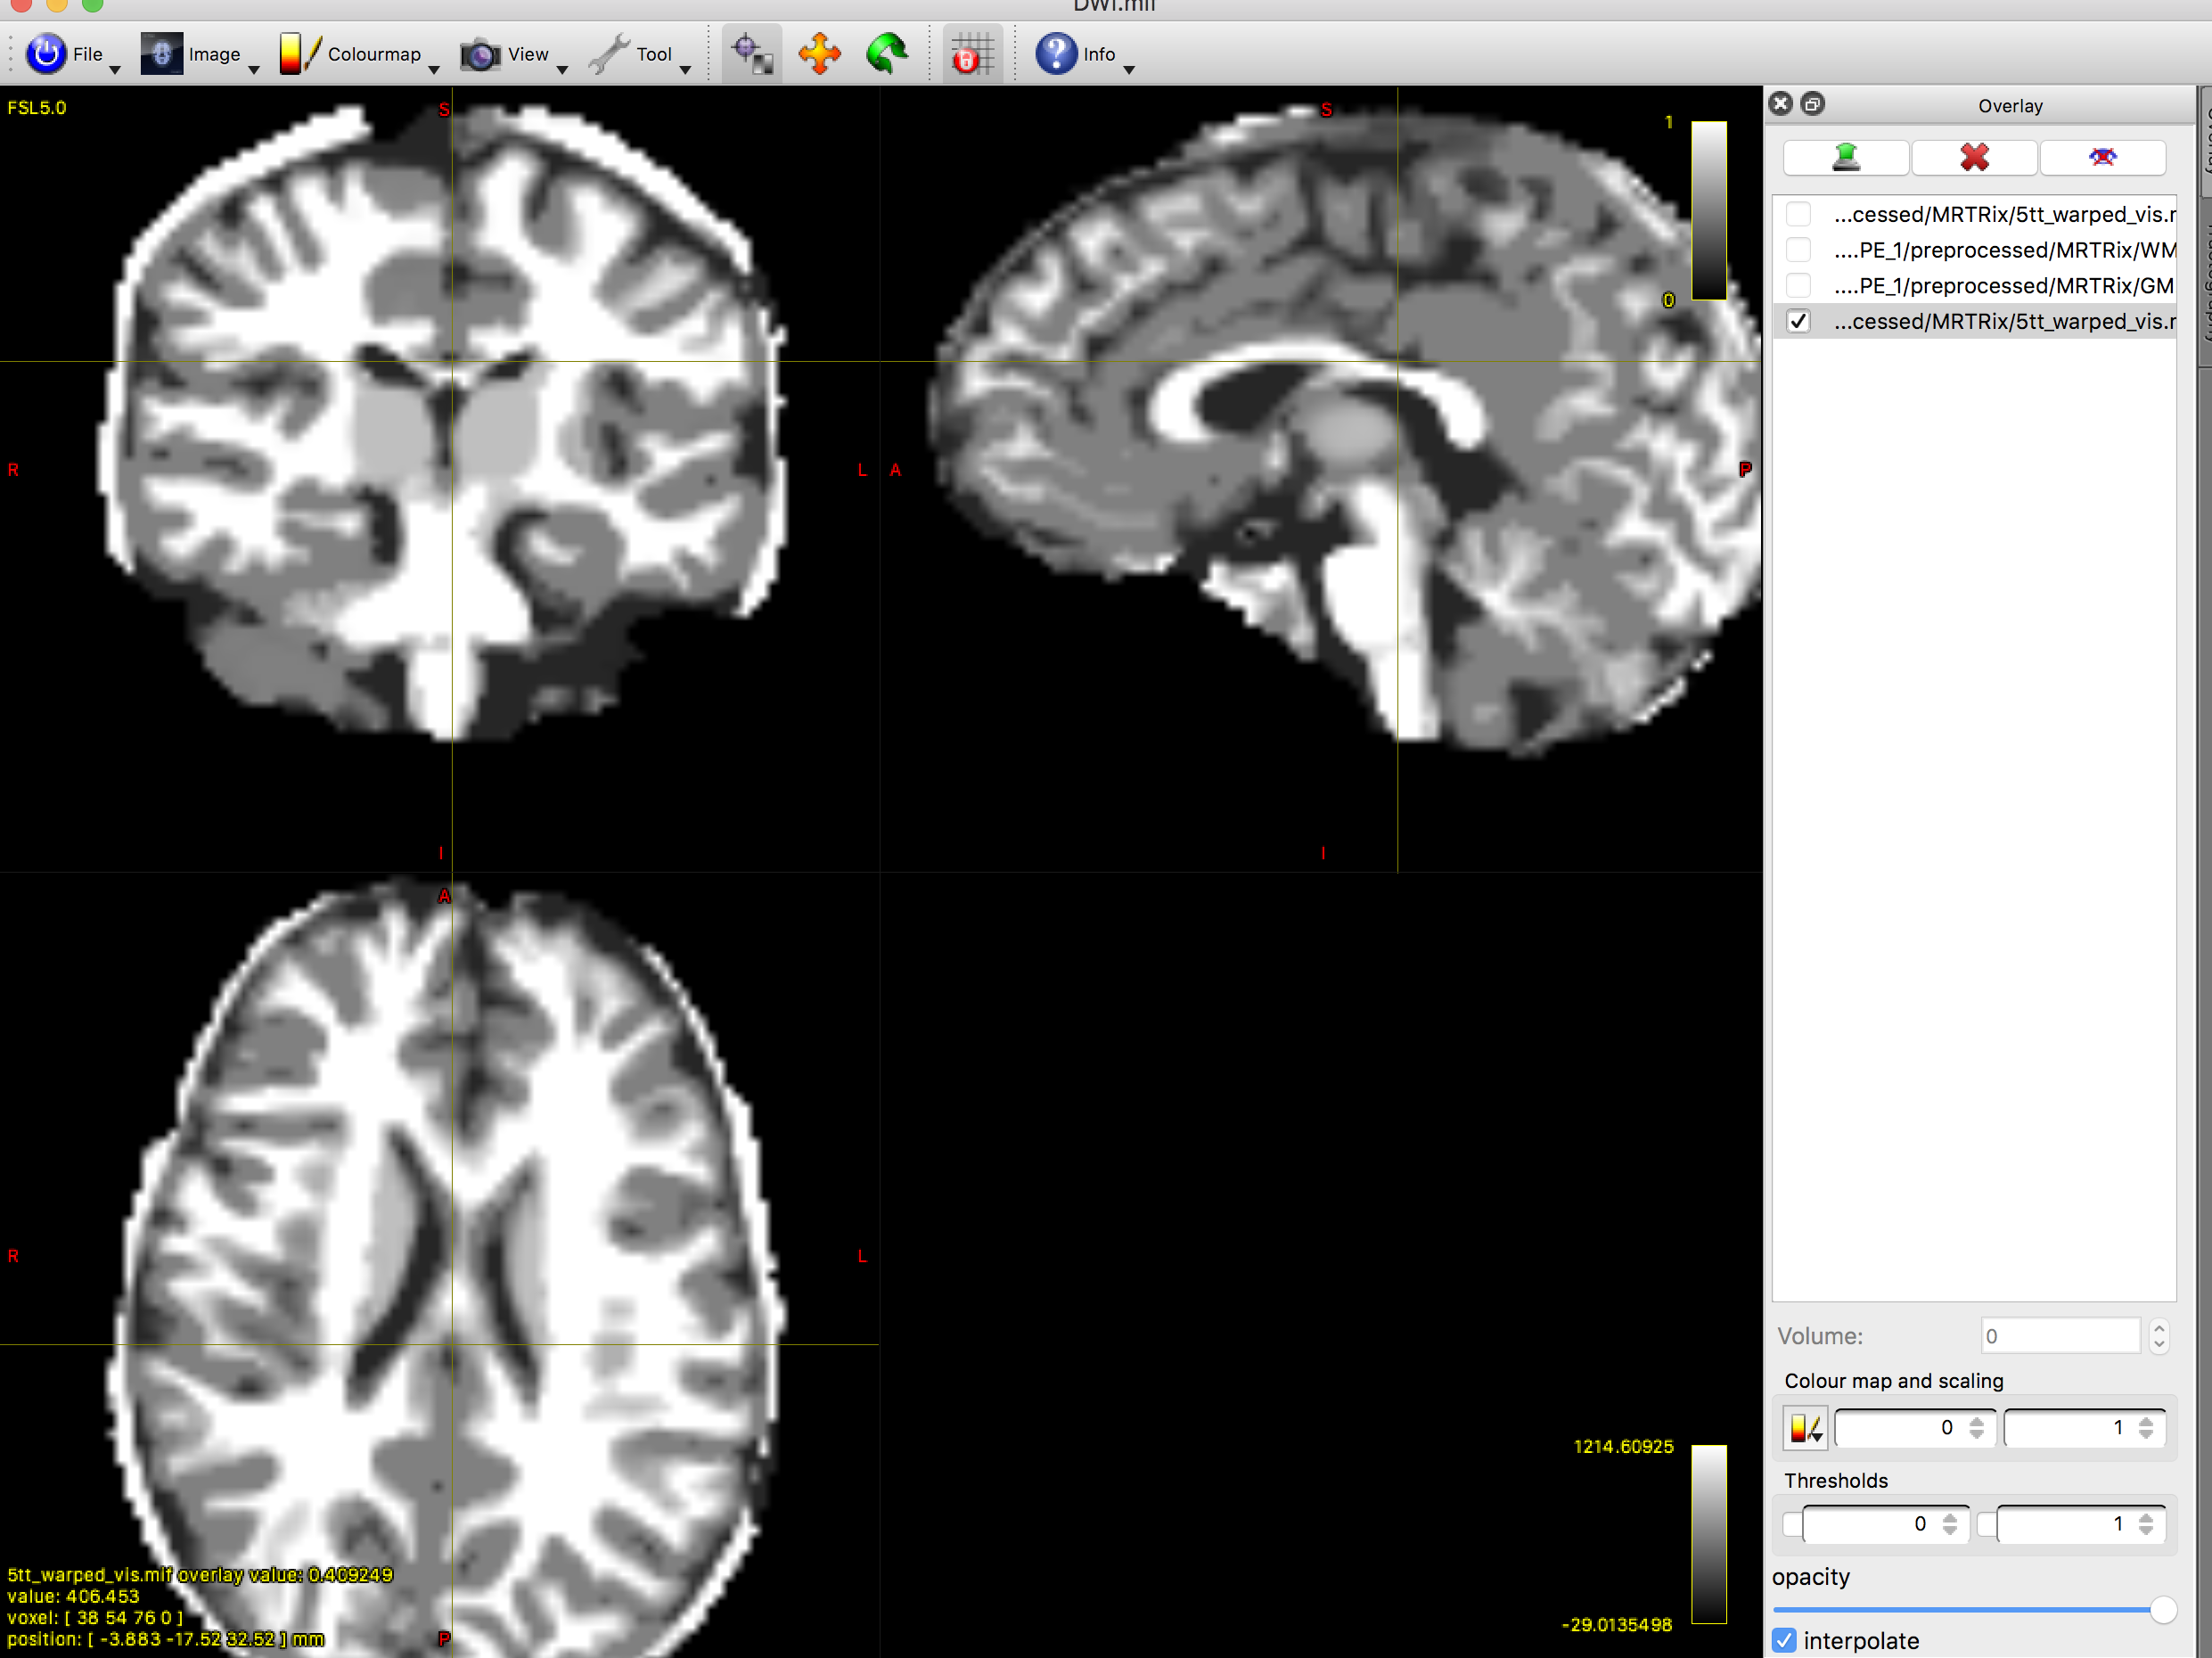
That screenshot only shows the first of the five volumes; in order to properly assess what’s going wrong, I’d need to be able to see all five volumes.
However, I’m going to take a stab in the dark anyway. It looks to me like for whatever reason, FAST is not providing the expected tissue classifications based on a T1-weighted image for your data.
In the first image you provided:
- The darkest tissue is CSF, as expected;
- The middle tissue (normally GM) contains both GM and WM together;
- The brightest tissue (normally WM) has instead segmented a bright band outside the skull.
I can’t properly assess the second image, since I can only see one of the five volumes and not the greyscale visualisation image, but you can clearly see that this tissue component (volume index 0, so should be cortical GM) contains primarily WM, with a bit of cortical GM. This would seem consistent with what happened in the first image you posted.
So, things you can try:
-
Make doubly sure it is in fact a T1-weighted image that you’re providing to 5ttgen.
-
Try obtaining a better brain masking (make sure that bright band outside the brain is masked out), then re-run 5ttgen with the -mask option. It’s possible that whatever is providing the high intensities out there (which isn’t being removed by bet when it’s called within 5ttgen) is so severely skewing the image intensity histogram that it’s correspondingly invalidating the classification of fast’s Gaussian mixture model components into brain tissues.
Rob