Where ${number_of_tracts} is a number that changes from 100K to 20M (100K, 200K, 500K, 1M, 5M, 10M, 20M). Then, I create the connectome with this command:
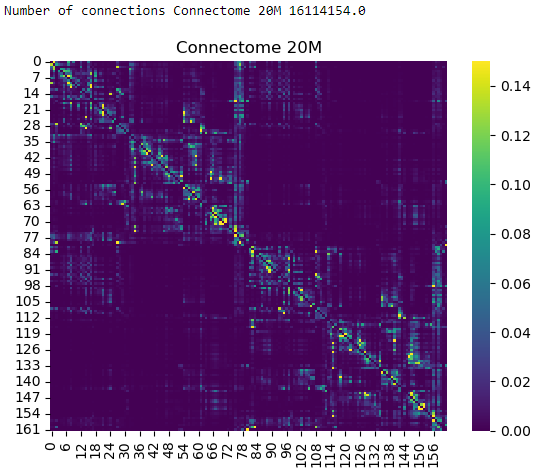
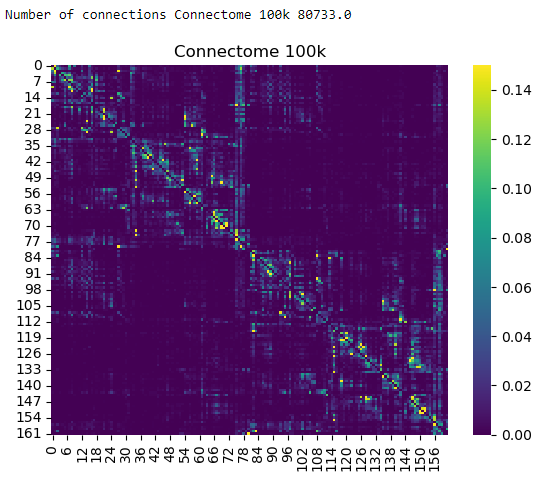
My intention with this experiment was to find the minimum amount of tracts I need so my connectome stabilizes. However, when I computed the connectome, I always found the same pattern in the connectome and they all got a Pearson correlation product of 0.99 with the 20M connectome. Here a couple of pictures of the connectomes normalized so I can compare them. They change in the number of total fibers but not in their aspect:
Is there anything written or discussed about this topic? Do you think this is an expected behavior?
This is a very interesting problem, I guess it might have something to do with the different deterministic or probabilistic algorithms in tckgen ( tckgen — MRtrix3 3.0 documentation).
Assuming you used the IFOD2 algorithm,even if you set a different number of streamlines, intuitively, they should generate similar(normalized) results.
Just a guess, looking forward to more replies!
Yes, I used IFOD2. My question then is why people would compute connectomes of 10M while connectomes of 1M or even 100k fibers are equivalent. I guess they may be useful for some applications…
this is a useful experiment, and thanks for sharing the abstract @mblesac - it makes a strong case for using the mesh based approach by @chunhungyeh - especially if you are in need of a very densely parcellated connectome (and perhaps more streamlines to go with it) … does anyone know if the mesh based approach is available to users?
cc, Yeh CH, et al. Mesh-based anatomically-constrained tractography for effective tracking termination and structural connectome construction. Proc. ISMRM. 2017; p.58
Hey!
I worked on a project last year that looked at how many streamlines we need to get reproducible complex network measures (graph summary stats computed from the connectome, see Brain Connectivity Toolbox). If you go to the paper you’ll see some plots where we look at the complex network measure values over 50 streamline/“fiber” counts (100… 50 mill) and see some “leveling off” of rate of change with increasing counts.
It turns out this is a complex problem and probably depends on a lot of decisions (seeding scheme, tracking algo, multi-shell/single-shell, etc, connectome weighting). We’re trying to look at these other factors now and hopefully arrive at some generalizable/useful answers - stay tuned!