Dear MRtrix users and devs,
I’m processing a database with these parameters: b0 (six volumes), b1 =1000 (with 64 directions) and b2 = 2500 (with 64 directions).
I used the following main options and commands before tractography:
dwi2response dhollander,dwi2fod msmt_csdand the average response functions for each tissue,mtnormalise
For the tractography, I ran:
> tckgen CSD/wm_fod_norm.mif TRACTO/100k.tck -act T1/5TT.mif -select 100000 -backtrack -crop_at_gmwmi -seed_dynamic CSD/wm_fod_norm.mif -maxlength 250
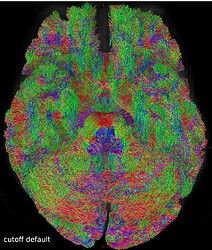
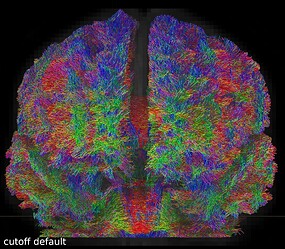
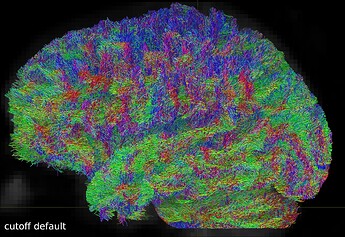
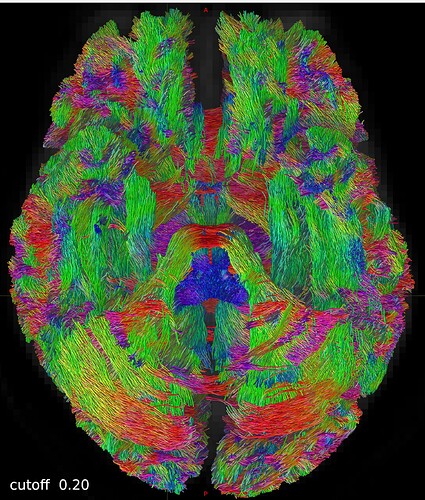
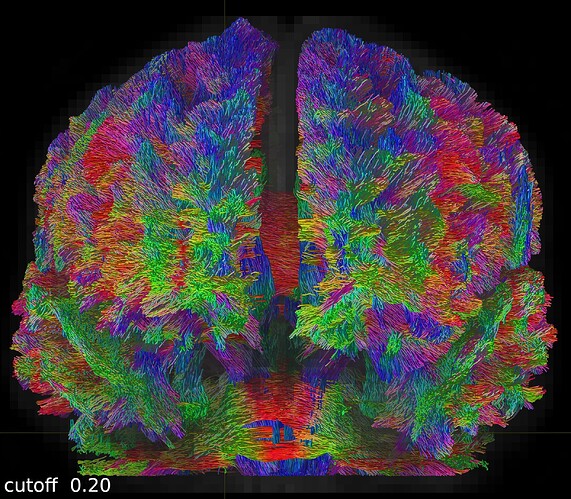
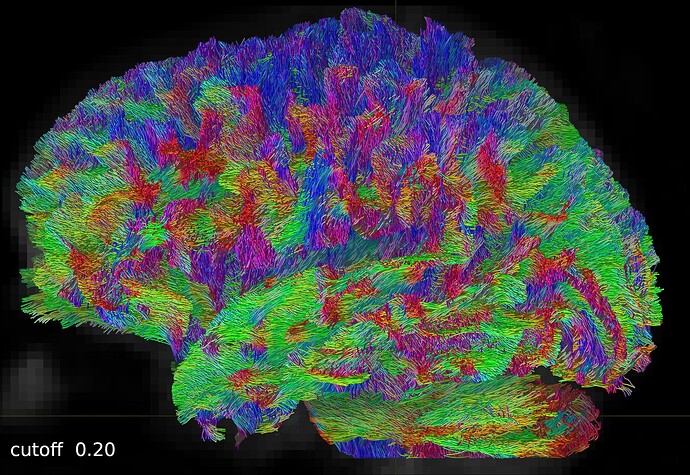
But when I visually checked this first tractogram, I found it a bit ‘messy’:
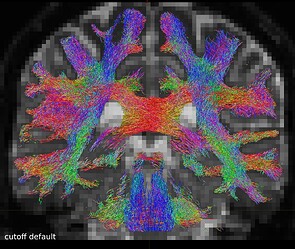
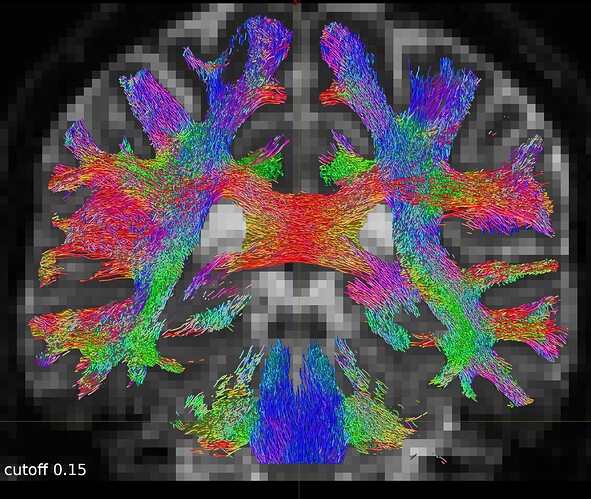
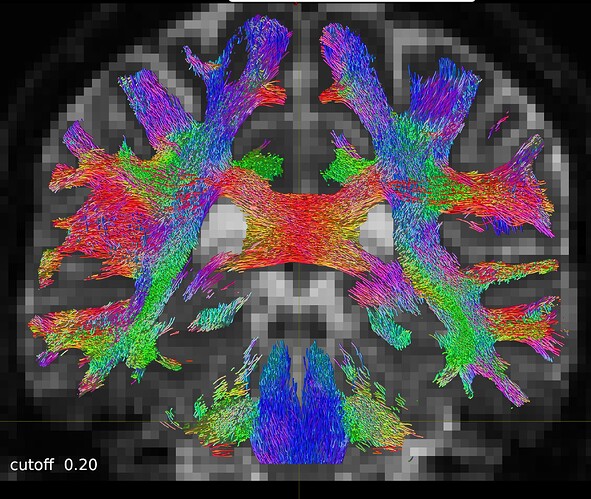
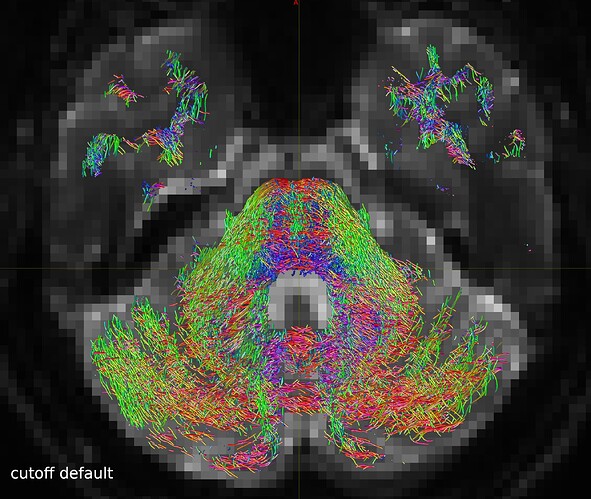
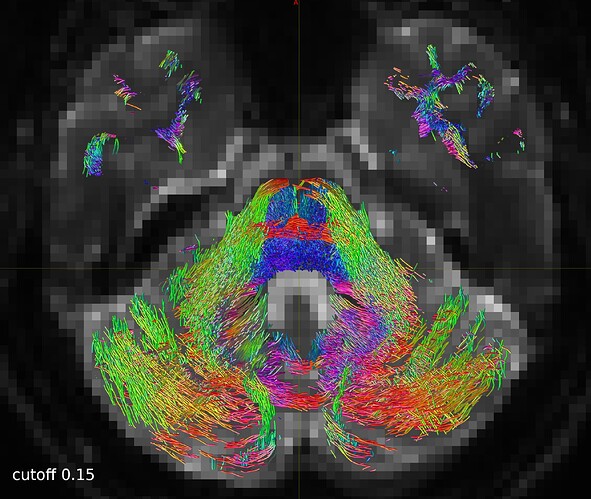
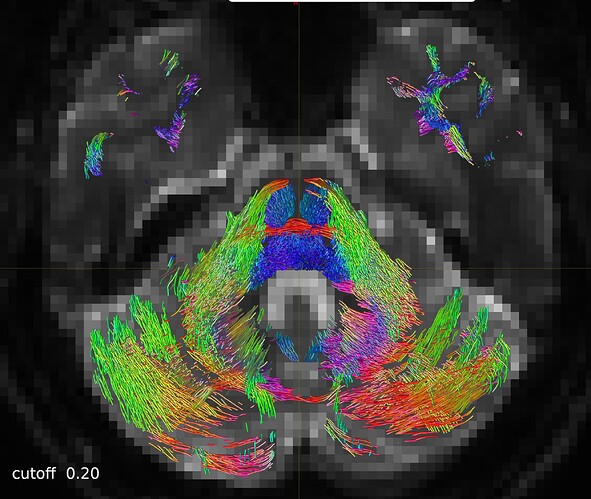
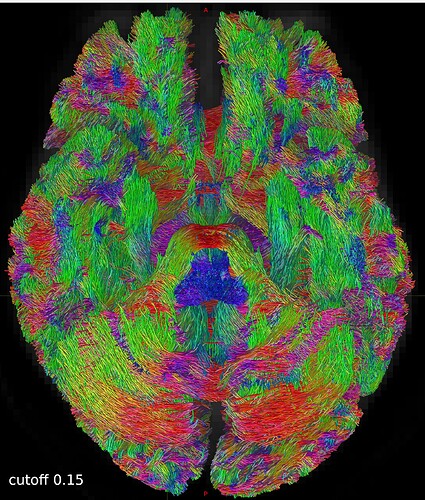
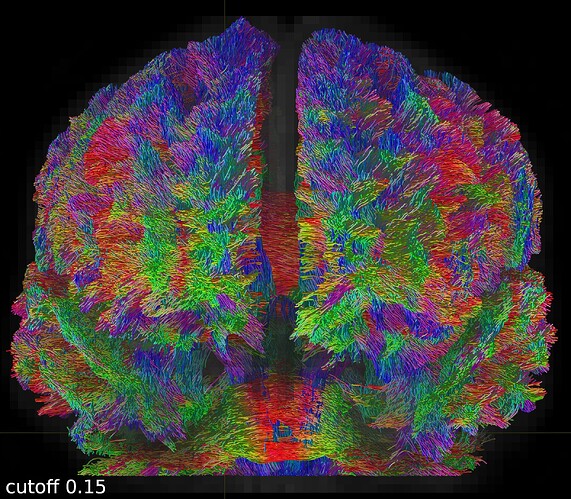
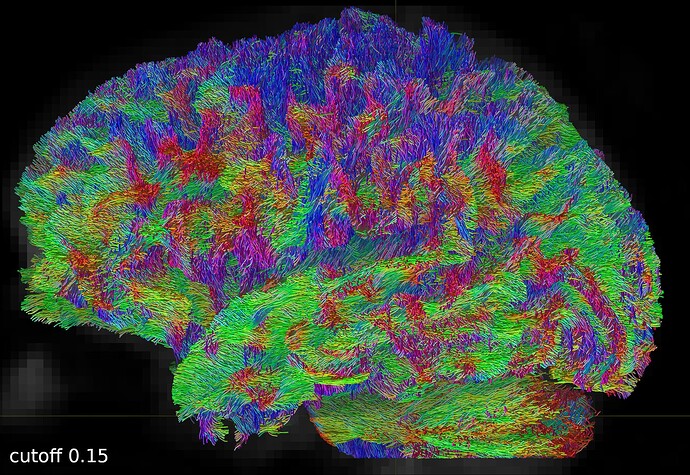
So I repeated the tckgen command but tried different thresholds (0.15 and 0.20) for the cutoff option. With the default cutoff, I also find some right-left streamlines that (I believe) are wrong, while increasing the cutoff threshold they disappear (as expected).
Here are some screenshots to compare them:
One coronal slice:
One axial slice:
So, my question is: which threshold would you use to obtain a ‘good’ tractogram without too many false positive streamlines and preserving white matter structures effectively?
I really appreciate your expertise and feedback. Thanks a lot!
Cheers,
Stella
PS: If you are interested, I leave more screenshots here:
