Data quality check

Dear Mrtrix experts,
We are preparing a DWI protocol for a 20-channel coil on a Siemens trio scanner. The protocol consists of a multi-shell (b0 b1000, and b2000) with both shells having 98 directions acquired in AP-PA directions. The voxel size is 1.7mm. I have two datasets acquired with 64-channel and 20 -channel coil, both with the same acquisition parameters. The 64-channel coil is the regular coil we use in our study, and 20 channel coil is for exceptional cases. Our primary purpose is tractography between the cerebellum and thalamus. Currently, I am inspecting the quality of data for 20 channel coil. As some quality checks, I tried to calculate SNR with methods @jdtournier explained in this thread:

I used the below commands to extract the wm mask from the largest b-value with 98 volumes, mean of signal in b0 b1000 b2000 after denoising, mean of the noise, and then divided the later values to get SNR within wm.

dwiextract dwi.mif -no_bzero -singleshell - | amp2sh - - | sh2power - -spectrum - | mrconvert - -coord 3 1 - | mrthreshold - wm_mask.mif

mrstats -output mean -mask wm_mask.mif noise.mif
dwiextract -shell X dwi_denoised.mif - | mrstats - output mean -mask wm_mask.mif -allvolumes -

for HARDI -20ch coil :
noise within WM : 367.762
signal within WM: b0=4328.56 b1000= 1955.16 b2000=1450.61
SNR _b0 = 11.77
SNR_b1000 = 5.31
SNR_b2000 = 3.94

for HARDI- 64ch coil
noise within WM : 221.267
Signal within WM: b0 = 3991.04, b1000=2118.96, b2000, 1324.15

SNR_b0 = 18.03
SNR_b1000 = 9.57
SNR_b2000 = 5.98

Is the notion of SNR>15 in b=0 shell and >5 in the outer shell standstill when calculating SNR within the wm, or it applies to the whole brain? How can I interpret these values if they are satisfactory for our purpose?

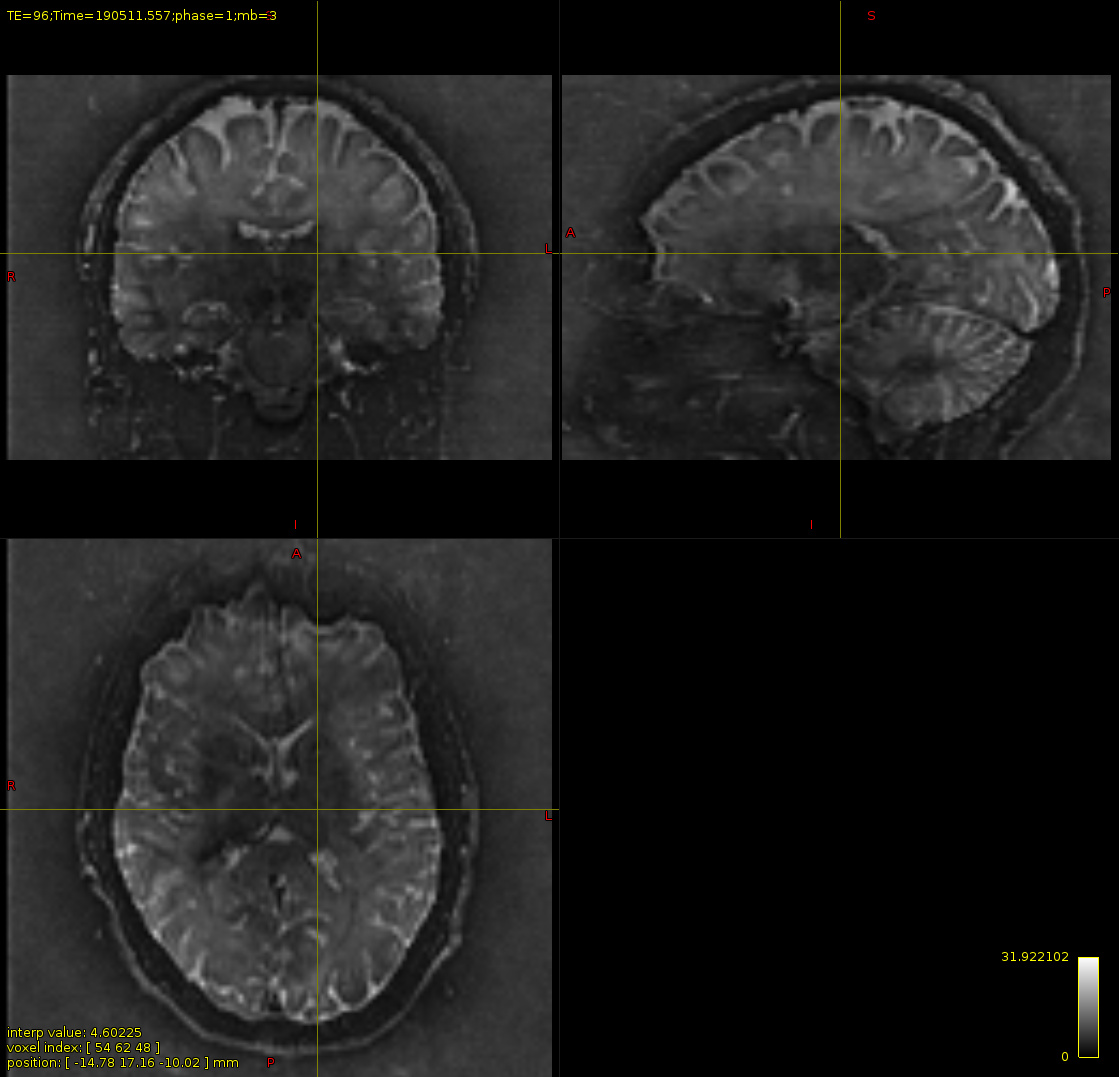
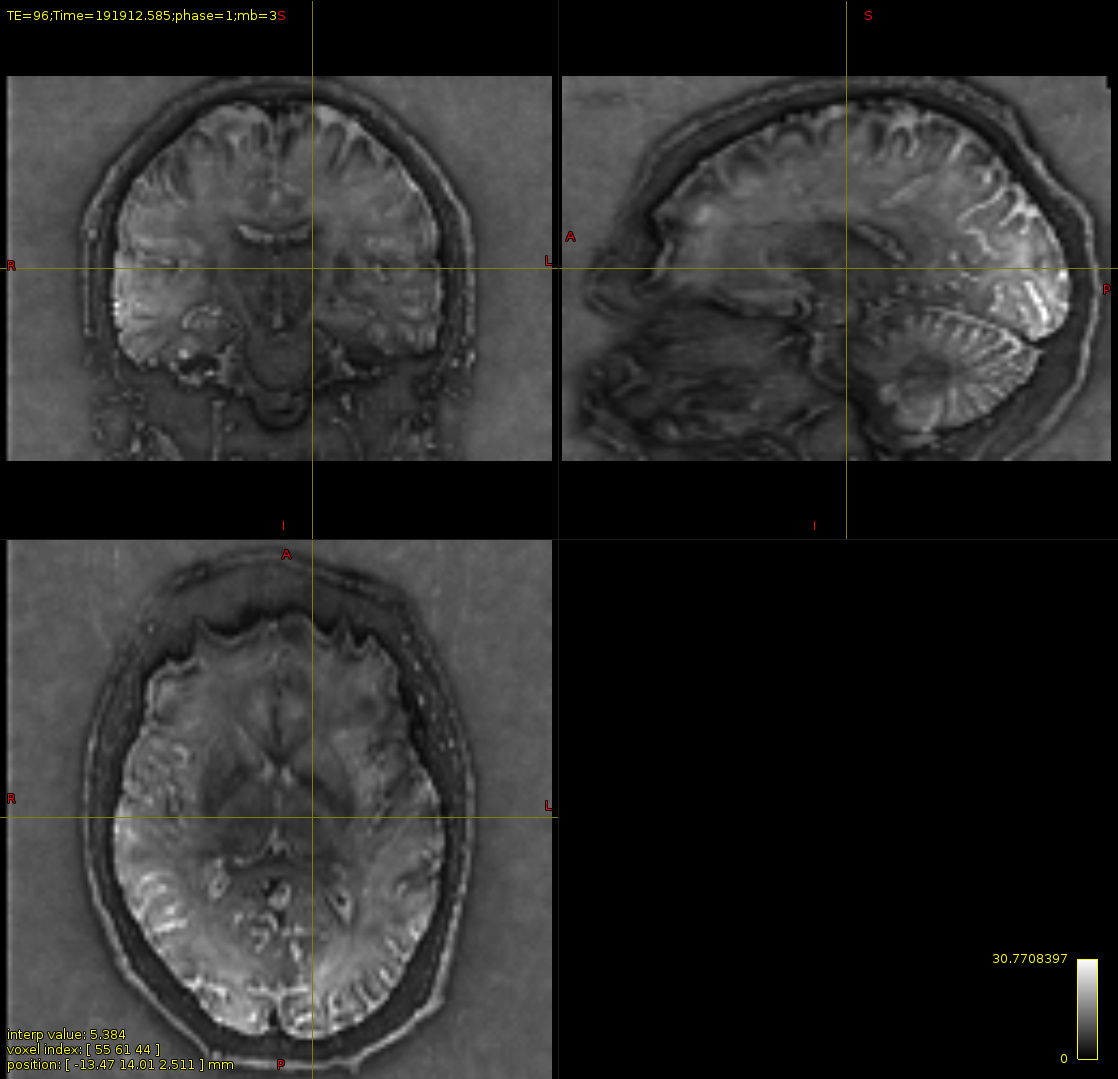
Furthermore, I generated the SNR map for both protocols, and the SNR seems to be lower in deep parts of the brain than the 64channel coil. However, I am not convinced if the 64 channel coil is good enough to take it as a reference for comparison.
Do you have any comments on our data quality, especially the one with 20 channel coil?

SNR for 20-channel coil

SNR for 64 channel coil

As the last question, how do you generally asses the quality of data? Except SNR and FODs, are there other considerations to take into account before commencing huge data collection?
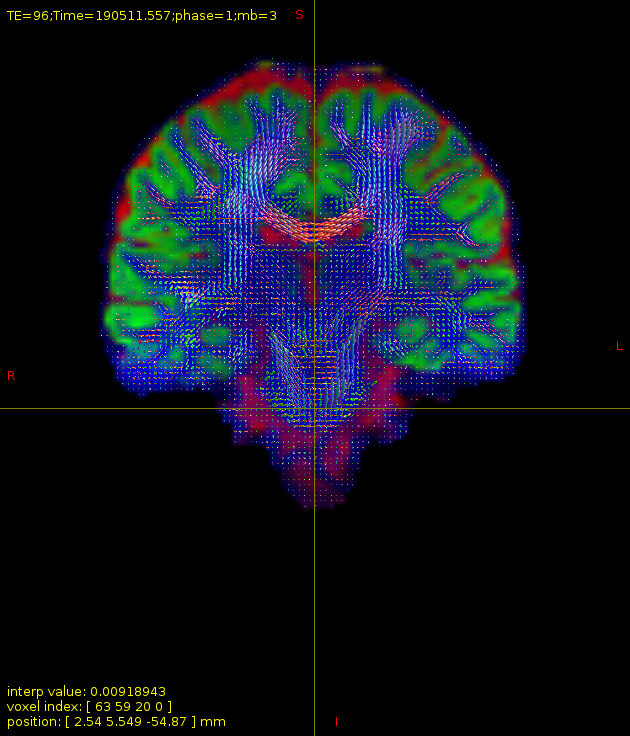
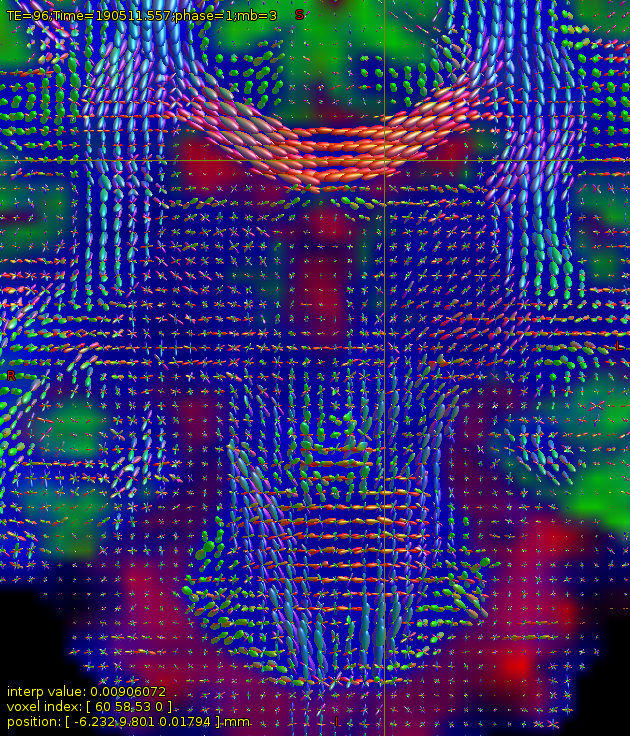
I have attached some screenshots(20ch coil) of FODs which might be helpful as further inspection.
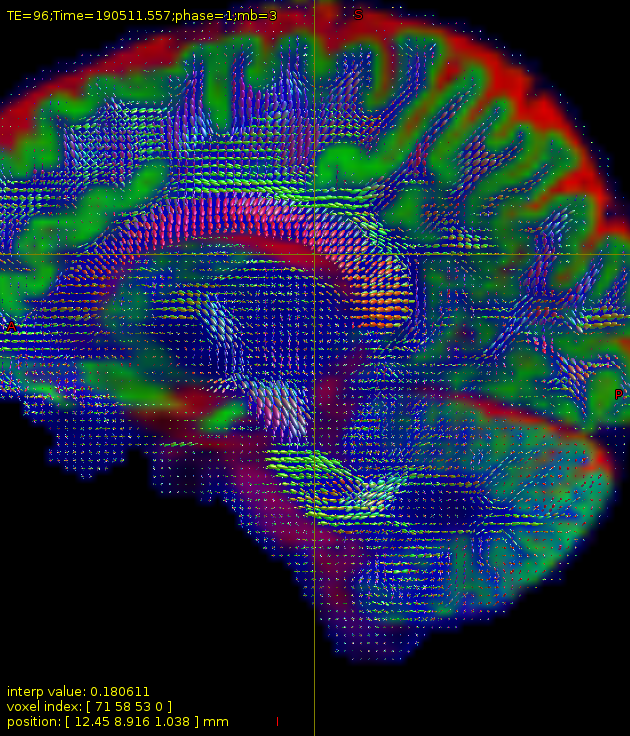
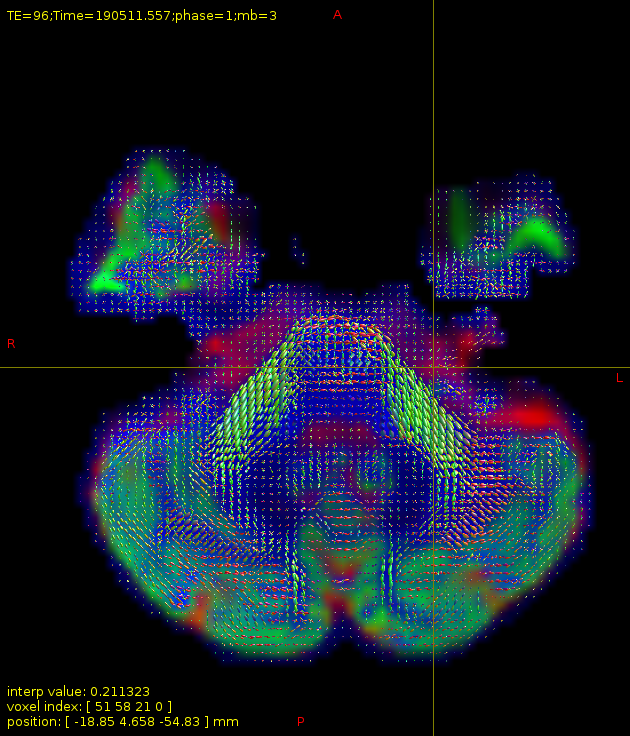


Thanks!

It’s always difficult to give definitive advice about what’s ‘good enough’, it will always depends on exactly what the data is to be used for – and that’s typically a moving target: data acquired now will usually end up used for all sorts of unexpected things a few years down the track, as more advanced techniques become available, etc. There’s always an element of crystal ball gazing involved…

With that caveat, I’d start by refining the SNR computation slightly. I’d compute a map of the mean signal in the b=0 images and divide by the corresponding standard deviation of the b=0 signal (I’m not sure how the maps you show were generated?). That’ll give you a map of the SNR, which you can then use to look at the regions you’re actually interested in. I’m not sure a single average SNR value for the whole of the WM is all that informative with modern multi-channel coils.

A suitable set of commands to do this might be:

dwiextract -bzero dwi.mif - | mrmath - mean -axis 3 mean_b0.mif
dwiextract -bzero dwi.mif - | mrmath - std -axis 3 std_b0.mif
mrcalc mean_b0.mif std_b0.mif -div snr_raw.mif
mrfilter snr_raw.mif median  snr_filtered.mif

That last step applies a median filter the SNR map to produce a cleaner image, since these maps can be quite noisy (perhaps unsurprisingly…).

In your case, you want to look at the brainstem, where the tracts you’re interested in will be. This is the hardest part of the brain to image from the SNR point of view: it’s furthest from the coil elements. You’ve also got distortions to deal with, which all makes this quite a challenging region.

I typically recommend a minimum SNR of 15 in the b=0 signal (not much point looking at the b>0 signal in my opinion), in the region you need to study. But that recommendation applies to the data fed into the CSD step. When using denoising, I’d suggest it might be more appropriate to look at the SNR of the denoised data, which you can do using the mean(b=0)/std(b=0) approach – but not using the noise map produced by dwidenoise. You’d just need to substitute the dwi.mif in the commands above with the denoised ones.

On the topic of denoising: if you’re setting up the protocol, I would strongly recommend you produce the phase maps for the data: this can be used to regenerate the complex data, which in turn can be used to substantially improve the denoising (see docs for details). This is definitely worth doing.

Finally, while the recommendations above are probably sensible as a starting point, there’s no getting away from the fact that the proof is in the pudding, so to speak. The best test of whether these data are ‘good enough’ is to try to perform the kind of analysis you’re actually planning on doing, and check that for example you can delineate the tracts of interest with some degree of reliability in a few pilot subjects.

Hope at least some of the above is helpful… Good luck!
Donald.

1 Like

Thank you so much for the detailed feedback.
As you explained, I re-calculated the SNR, and the resulting maps are relatively darker than the above ones. I scrolled randomly over voxels within the thalamus, and the SNR value could hardly pass the value 10.
Despite the SNR differences between the coils, I ran the tckgen command to reconstruct 1 million streamlines between the left dentate nucleus and the right thalamus. It has been running since yesterday (more than 24h), and only 3500 streamlines have been selected for 20ch coil and 18k for 64ch coil. I have to add that the same command only takes several hours for the HCP dataset. I faced this issue a couple of times with our dataset, and each time I terminated since it is not sensible to run a command for at least ten days.
Here is the command:

tckgen -act 5tt.mif -backtrack -seed_image RightDentate.nii.gz -include L_Thalamus.nii.gz -exclude pons.mif -select 1000000 -seeds 0 wmfod_norm.mif 1mio_RdenLThal.mif

Is there a possibility for a command to go in an endless loop without getting the error or warning? Or the reason for being slow is low data quality, which hinders the algorithm from tracking streamlines faster.
I really appreciate your support and fast replies.

Yes, I’m not surprised. Looking at your FOD images, it does look pretty noisy around the pons. The reason this then slows down the tractography is that streamlines then disperse more randomly than they would in clean data, and this means far fewer of them make it to the end ROI. This is particularly pronounced in difficult to track situations, and when the size of ROIs is small. It just means only a tiny proportion of the streamlines generated make it to the end ROI.

So I would say that the main issue here is indeed SNR.

1 Like