Hi all,
I have been running dwi2response dhollander and dwi2fod msmt_csd to generate FOD maps for each subject in my data. However, when I check each individual’s voxels.mif/vf.mif data, some of data have corrupted/abnormal FOD maps. I couldn’t find what is common among those corrupted images, and I am not sure what kind of parameters I should check.
These are the codes I ran:
dwi2response dhollander ${dir}/${subname}/${subname}_unbiased.mif -fslgrad ${dir}/${subname}/${subname}_merged_dwi_gibbsCorrSubVoxShift_TED_synthB0.bvec ${dir}/${subname}/${subname}_merged_dwi_gibbsCorrSubVoxShift_TED_synthB0.bval ${dir}/${subname}/${subname}_response_wm.txt ${dir}/${subname}/${subname}_response_gm.txt ${dir}/${subname}/${subname}_response_csf.txt -voxels ${dir}/${subname}/${subname}_voxels.mif
dwi2fod msmt_csd ${dir}/${subname}/${subname}_unbiased.mif -fslgrad ${dir}/${subname}/${subname}_merged_dwi_gibbsCorrSubVoxShift_TED_synthB0.bvec ${dir}/${subname}/${subname}_merged_dwi_gibbsCorrSubVoxShift_TED_synthB0.bval ${dir}/${subname}/${subname}_response_wm.txt ${dir}/${subname}/wmfod.mif ${dir}/${subname}/${subname}_response_gm.txt ${dir}/${subname}/gmfod.mif  ${dir}/${subname}/${subname}_response_csf.txt ${dir}/${subname}/csffod.mif -mask ${dir}/${subname}/${subname}_masked.mif

mrconvert -coord 3 0 ${dir}/${subname}/wmfod.mif - | mrcat ${dir}/${subname}/csffod.mif ${dir}/${subname}/gmfod.mif - ${dir}/${subname}/vf.mif
I would appreciate it a lot if you suggest me anything that might be causing this and how to resolve it.
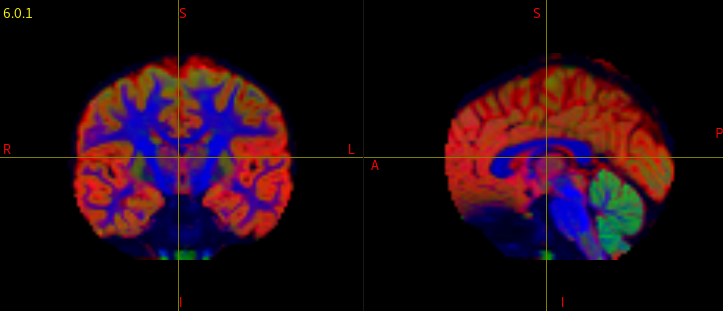
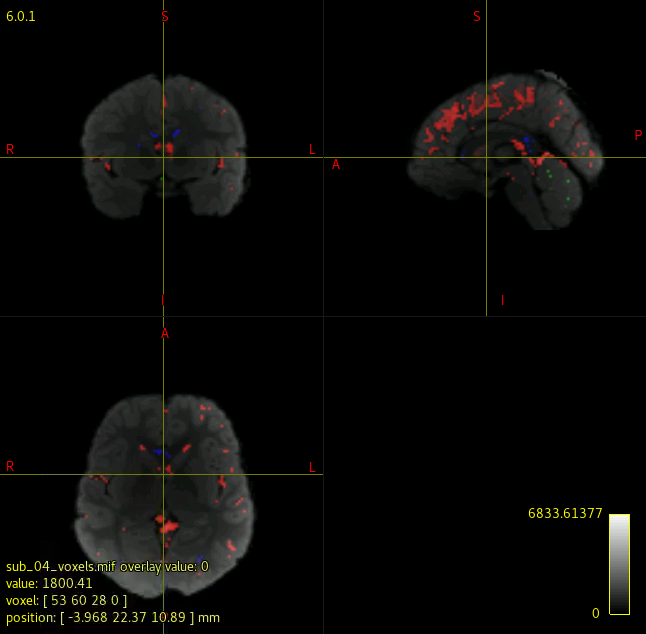
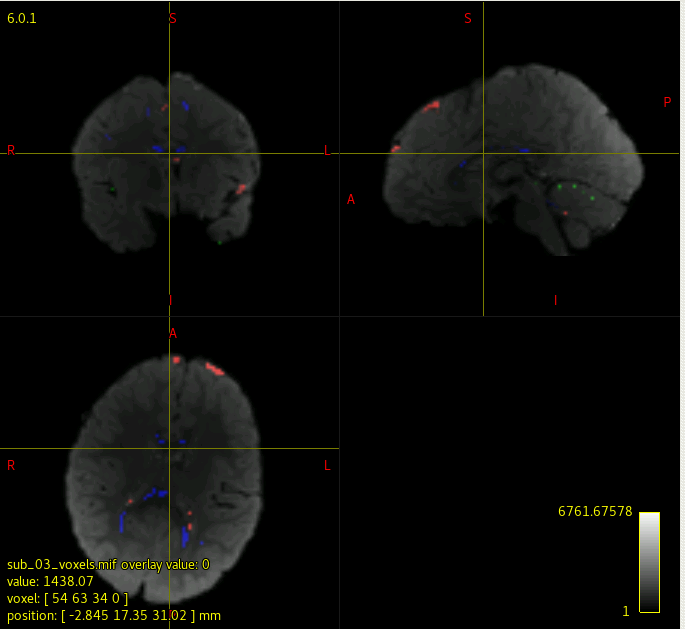
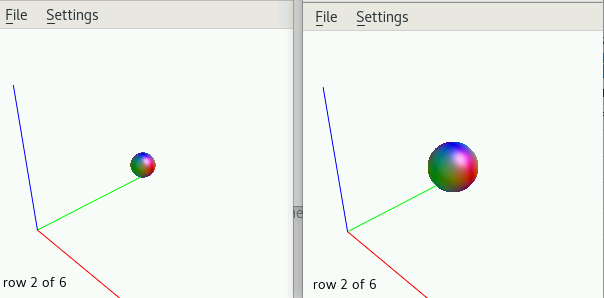
I attached the images of a normal, and corrupted FOD maps.
Many thanks in advance!!