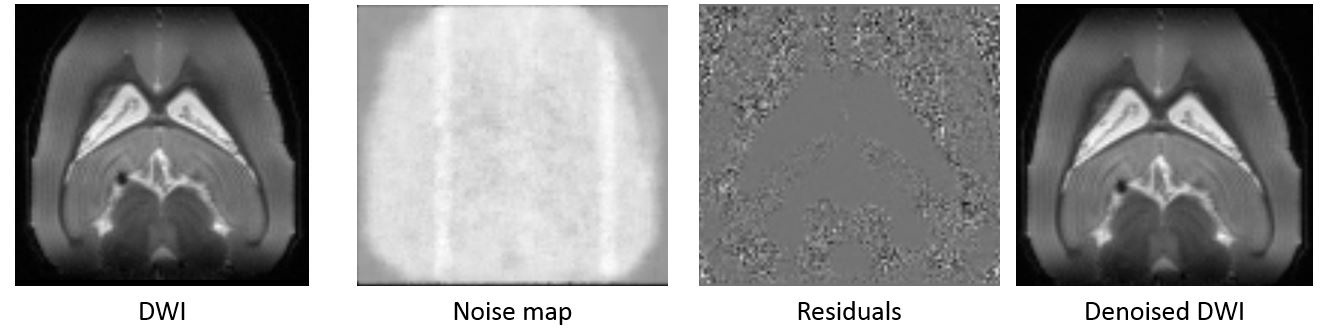
OK, that pattern in the noise map is a matter for concern. It’s hard to explain this away as anything other than a fixed-frequency RF contamination, or similar. I assume your frequency-encode (readout) axis is L-R? If that’s the case, you’ll need to check that the RF shielding is not compromised on your scanner, and whether there is any electronic equipment in the vicinity of your scanner that could emit RF noise at close to the Larmor frequency of your scanner…
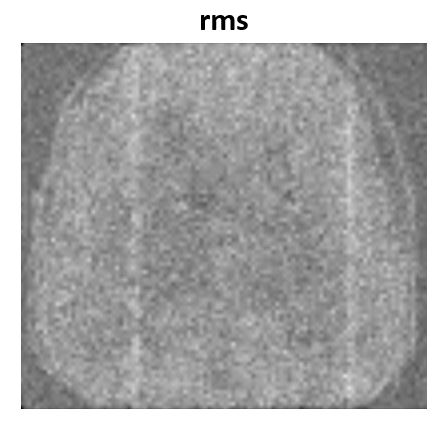
The residuals map also look unusual, but this probably corresponds only to the first volume, not the RMS across volumes? So there is a definite pattern for residuals of presumably the b=0 image (?). It’s worth looking through all volumes of your residuals image to see whether this pattern is consistent across volumes, or inspecting the RMS residuals using a command like:
Yes, it seems there is some RF leakage in the images (clearly visible in a couple of slices after scaling). So, I guess denoising should be be best avoided for this data/similar others
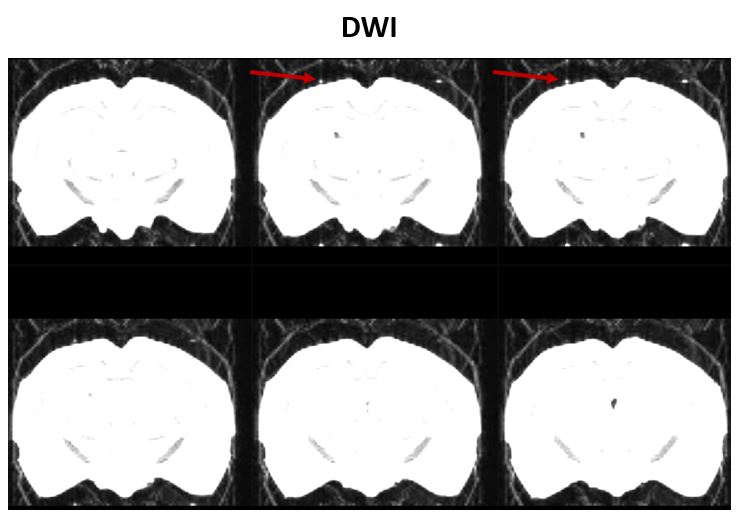
I have a similar issue to the above. When looking at my residuals I was concerned that I could see a bit of the lateral ventricles and perhaps the outline of the posterior fossa. Can I ask what you think of these snapshots? Do they look as expected or should I be concerned? Thanks as always! Paul
I have a question about the denoising, is it possible to run the denoising in the one image twice, and the results be slightly different? Thanks in advance.
I think I found the answer. When I run it now, I found the same results, but when I compare the image denoised now (version 3.0_RC2-2-gca446aad) with the same image denoised with the version 0.3.15-294-ge8a525c6-dirty, I found slightly differences, is that possible?
Yes, it is possible that you get small changes between different versions. As long as the differences are small you don’t need to worry about it. Let me know if you think they are too large to ignore, then I can investigate.
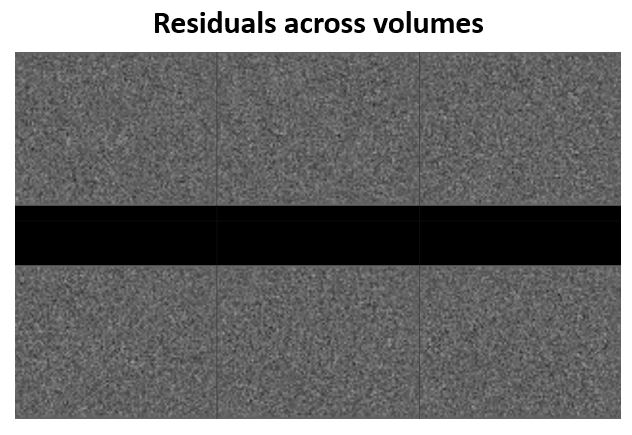
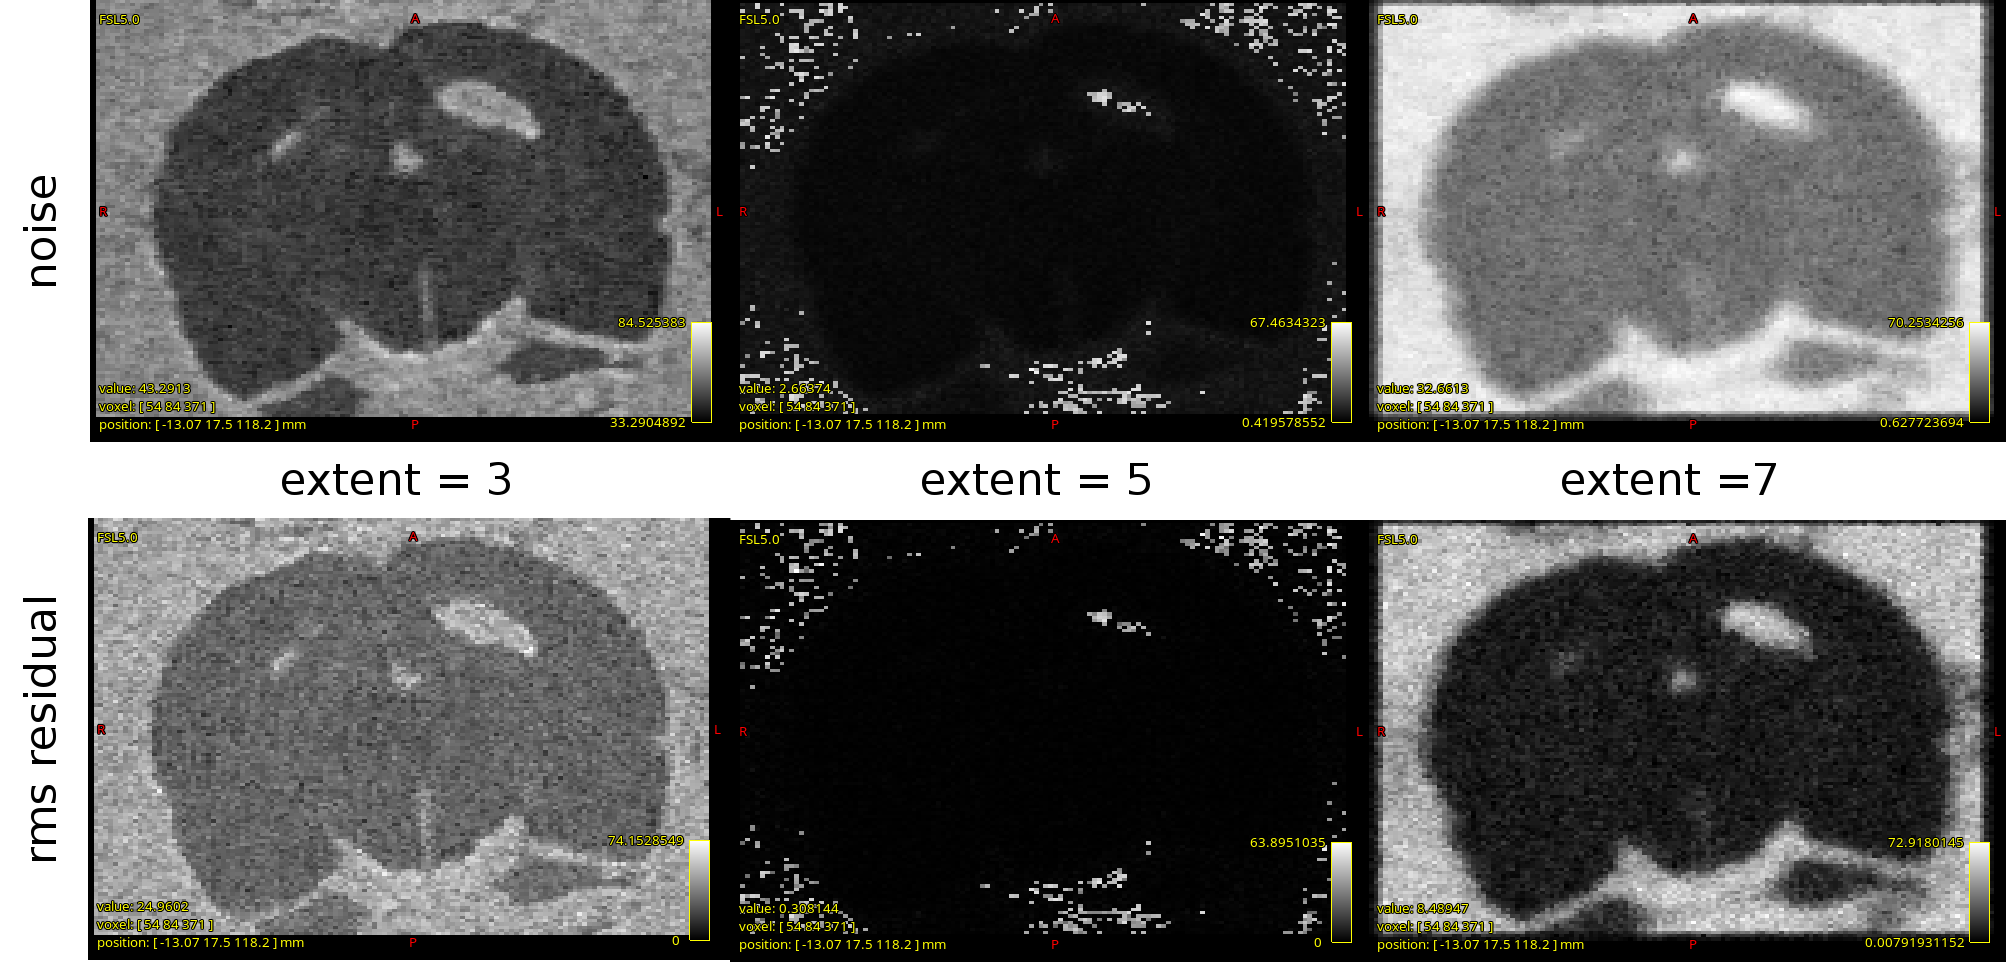
I’m adding to this thread, because I too am working with rodent DWI and have some interesting results from the dwidenoise command. This is my first time using dwidenoise, and none of the results I got seem to fulfill the “good residual” requirement of being free of anatomy.
Attached image shows the noise map and rms residual for dwidenoise, using three different settings for extent: 3, 5, and 7. Initially, I ran dwidenoise with default extent, yielding the middle image. It seemed suspicious, since there was definitely a brain outline. After consulting with others, I ran using the other extent setting, resulting in the other two results, which curiously shows even more anatomical structure.
This dataset contains 107 volumes, with 10 b0 images, and is obtained ex-vivo acquired over the course of 12 hours. Is this perhaps why so little noise is estimated with the default setting? This is one of the cleaner data, is this good data actually getting in the way of dwidenoise?
It may be off-topic. But, I am wondering if we can use the denoising algorithm that you showed in the neonatal virtual meeting session of the ISMRM lately. I am desperately waiting to use it.
I think dwidenoise is already the most suitable approach for you to use here… The denoising done as part of the dHCP takes it a bit further than that, but relies on very intimate knowledge of the acquisition and its properties (@dchristiaens might correct me if I’m wrong here), so isn’t something we can provide as a general-purpose tool.
However, you can get most of its benefits by denoising on complex data – which dwidenoise already supports out of the box. This gives you better denoising and because the noise is corrected before the magnitude transform, you get a reduction in the Rician bias for free. You’ll find some hints about how to do this in our docs. The issue here is that you do need to store the phase of the images as well as the magnitude – this can’t be retrospectively applied to magnitude data…