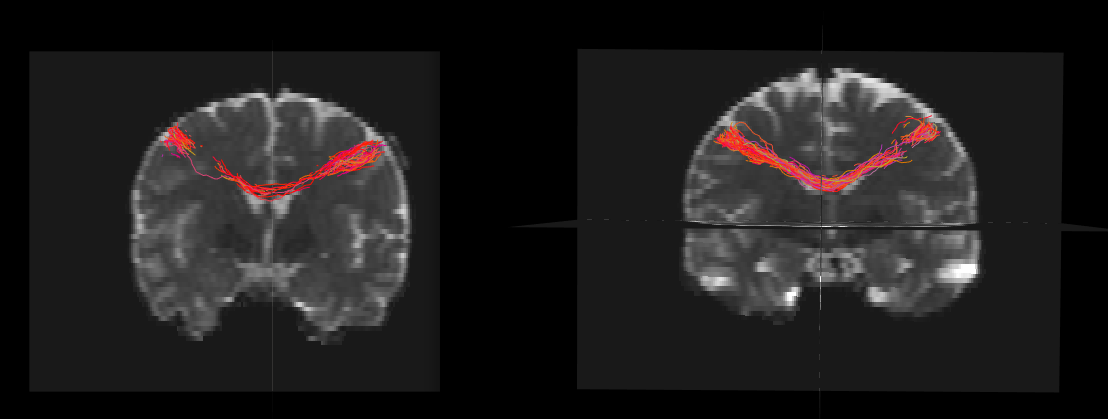
I’ve run into trouble with tract length. Specifically, I’ve reconstructed with iFOD2 the cortico-cortical tract which connect the left and right motor regions in all of my subjects. I’ve attached one subject and it looks ok to me.
Now I would like to estimate the average of the tract length across the subjects. I’ve used tckstats and it worked well but unfortunately I got pretty much the same length for all my subjects (117mm more or less). I mean that all the numbers vary in the order of 0.1-0.2 mm which highly improbable in the real world. Do you have any tips?
Given that all the analysis has been run in the subject space, I was wondering whether if I should correct the average lengths for some kind of within subject variable (e.g. brain dimension).
Could you paste a screenshot of the tckstats output for at least two subjects? The max value tends to remain quite constant but it is odd that the mean length is that regular. Have you tried using the -dump flag to output the individual streamline lengths?
Also, perhaps show tract visualisations of two individuals? Even perhaps overlaid?
Using the -dump flag should have output a file containing the length of the individual streamlines, for what it’s worth have a look at them, load then in MATLAB or python and compute the mean yourself.
However, from the tckstats output it does seem that everything is working properly … It is odd however (I would expect that head size has a bigger effect then that) … Perhaps someone else has thoughts.
Did you collect these data yourself? or are you using some publicly available data?
I imported the file containing the length of the individual streamlines in MATLAB and compute the mean myself but the results are the same.
I agree, it seems that tckstats worked properly but of course the results are affected by some kind of variable that I’m not considering for the time being. I believe that it highly unlikely that all the subjects have pretty much the same tract length.
As for the data, I collected these data in my scanner
Please if you have any suggestions it would be highly appreciate
I’ve not actually experimented with such data as much as @cbajada. But instinctively the consistency does seem fishy.
If you’re comfortable with Git branch hopping, you could try re-analysing the data using the dev branch, which contains a bunch of revisions to streamlines length calculations (not only in tckstats but throughout the package).
Are you using a script of any kind to run equivalent commands across subjects? There hasn’t been any kind of mistake where data for the same subject has been used repeatedly?
I’ve re-analyzed a couple of subjects using the dev branch and I’ve got slightly different results (e.g. different number of streamlines) compared to my fist analysis.
However, I still have the same issue since I observe almost identical values for both the subjects that I re-analyzed (e.g. they differ in the order of 0.1-0.2 mm).
Do you know which should be the extent of inter-individual variance in the tracts of my subjects? Considering brain dimension differences, I would expect more variance.
Thanks again
P.S. I’ve also reconstruted the tracts for IPL-M1 and IPL-DLPFC. Unexpectedly, I obtain values around 11 cm for both tracts, even though DLPFC is situated few cm more anteriorly compared to M1.
Having a look at the two brains - they look quite similar (size wise). My suspicion is that they have been normalised to some template (possibly linearly). Could this be the case?
What you could try to do is to compute the volumes of the brain masks - if these are the same (or of the same order) then that is probably the “issue”
all the analysis have been run in the subjects’ spaces (the images haven’t been normalised). Indeed, the brain volumes of the subjects that I’ve shared previously is different 1094708 vs 1048750.
This is not the issue I guess.
It does look like your endpoint regions are relatively small; that would potentially yield less variation in tract length compared to larger regions, where differences in GM geometry may have an influence. Similar with not using ACT: without constraints imposed by subject-specific brain geometry, using seed & target defined from some common space, maybe there’s just not enough scope for inter-subject variability to have an effect. You could try computing simply the Euclidean distance between the node centres and see what the variability in those data are like compared to the tract lengths? Not quite sure what insight it might yield, but sometimes these silly experiments can shine a light on the situation.