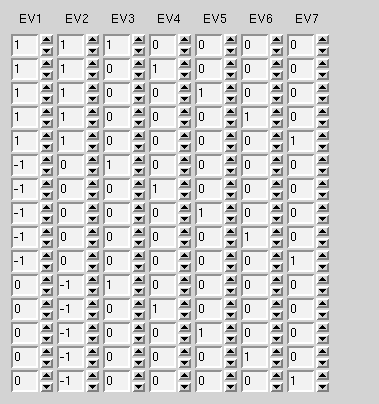
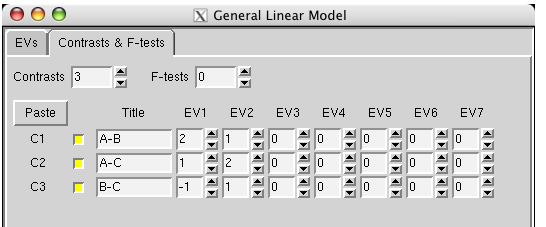
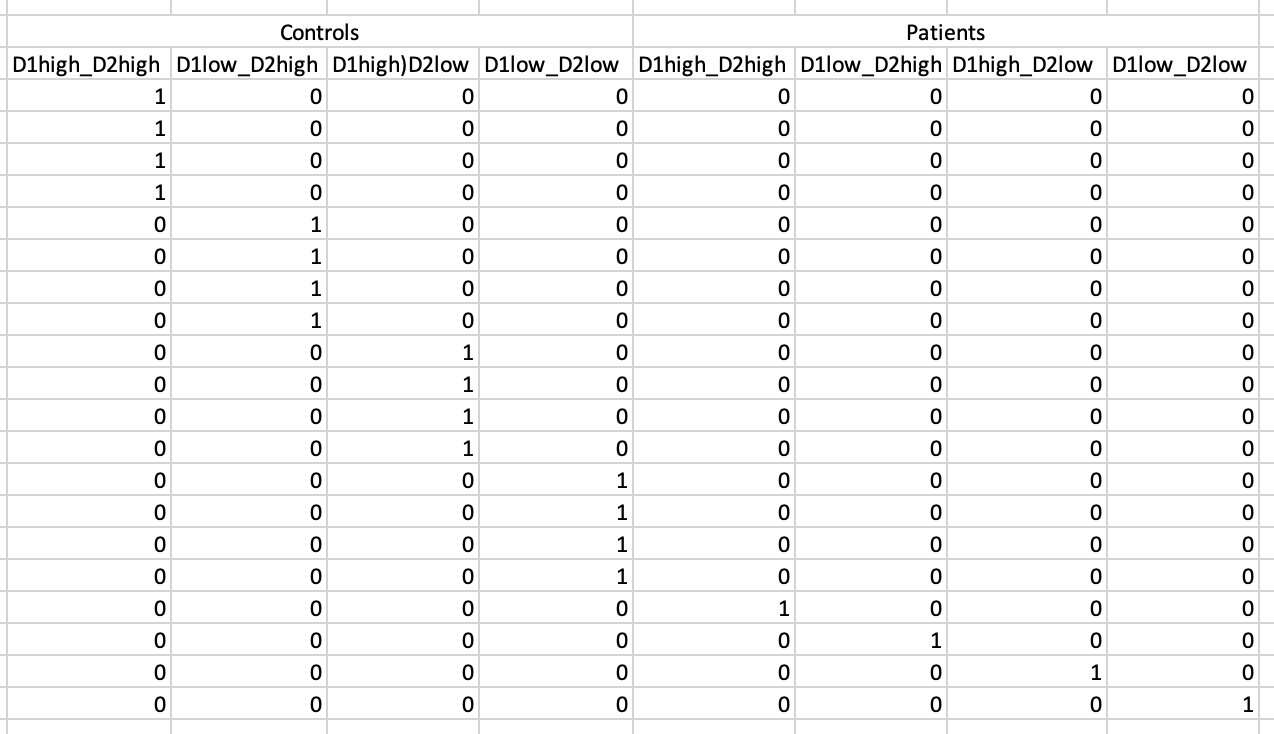
But When I see “Tripled” T-test,I wonder if there is “quadruple” T-test(Because I have data at four different times).
Those instructions are specifically for FSL feat; for FSL randomize, to which fixelcfestats is more closely related, the page states that such a test is not possible in an integrated fashion. Even if it were, I think that compound symmetry would be violated in your case, since the variance between pre- & post-treatment is likely different to the variance between post-treatment and 3 month follow-up.
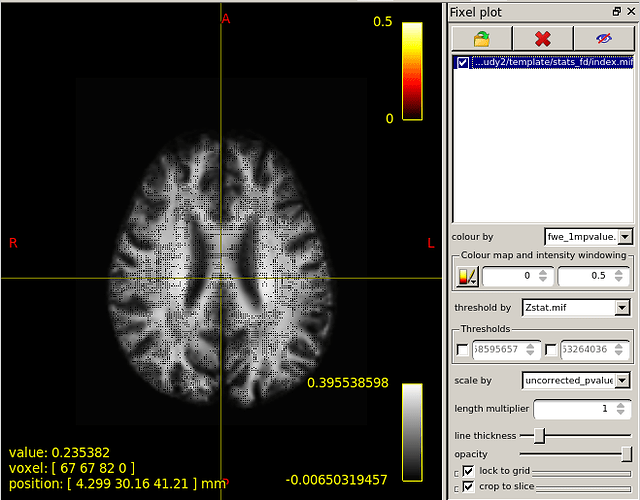
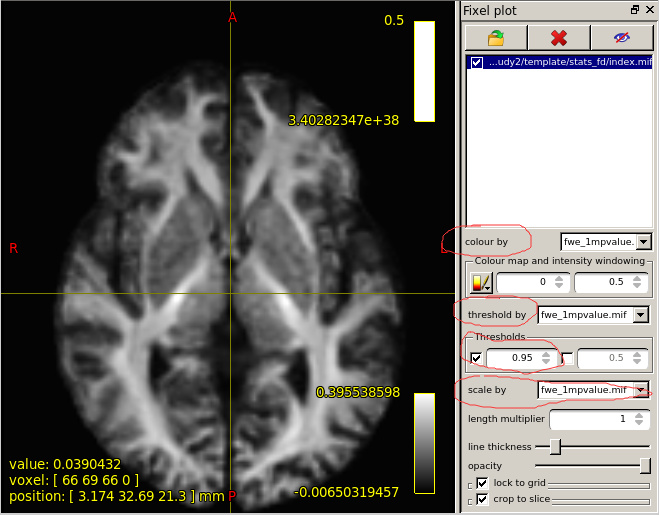
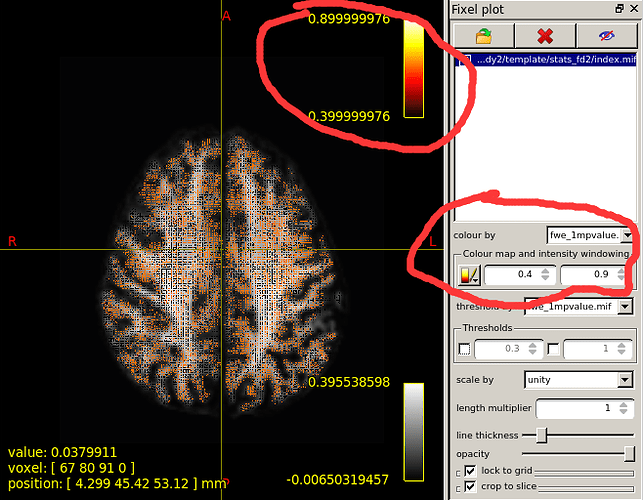
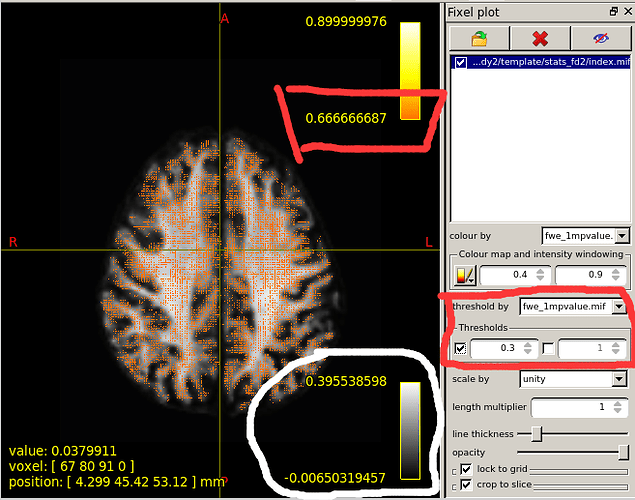
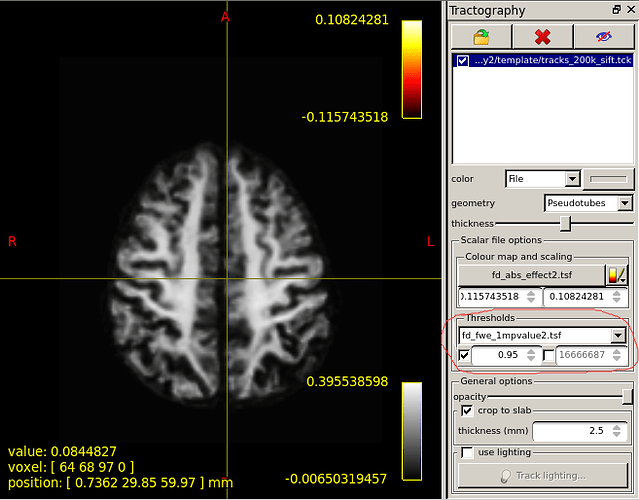
When I set the minimum Threshold as 0.4(I know it should be 0.95 if I want see P value is less than 0.05),The range of colourbar displayed values has changed to a minimum of 0.66666687(as is shown in the second diagram below).
I’d need to search through the code to confirm, but I believe what’s happening here is that the manual lower colour value (0.4) is mapped to the start of the colour map (black in the case of the hot colourmap); but when the colour map overlay is drawn, it only shows the visible portion of the mapping. So if, in your p-value image, there are no fixels that possess a value in between 0.4 and 0.667, then once you engage the lower threshold of 0.4, mrview determines that there is no purpose in drawing the portion of the colour map in between 0.4 and 0.667 because there are no fixels present with those values, and so “zooms in” on a subset of the colour map for the purpose of the overlay.
What range of values does the white coil represent?
This is the colour map of the main mrview image, i.e. the WM density template image in this case. So -0.006 maps to black, 0.0 maps to a very dark grey, 0.396 (and greater) map to white. A value of ~ 0.282 (1/sqrt(4pi)) corresponds to a fibre density equivalent to that of the response function.
I use two subjects and their data on two different time to "found significant differences in streamlines according to FIXEL with significant differences ".But no streamlines with any significant changes are shown.Maybe it’s because the sample size is too small?
I’m hoping that in doing so, the command will have issued a warning that based on the sample size it was unable to achieve the default number of 5000 permutations, and would instead utilise all possible permutations. In your case, the maximum number of permutations is 2. Therefore the smallest p-value that can be mathematically obtained is 0.50.
Cheers
Rob
 Watched a bunch of Jeanette Mumford’s brain stats videos, and read a lot of GLM theory…
 I ran a simple correlation using a single group to see if some behavioral measures associate with WM “integrity” (for lack of a better word…). The results look interesting, but I could not wrap my head around what the absolute effect output would mean in this scenario. I “discovered” it’s identical to my beta of interest. Am I understanding it right that it just is designed to create this output?

