I am a relatively new MRtrix user and try to run a fixel-based analysis for the first time. So far I have been able to tackle all occuring problems by myself, thanks to your elaborate documentation! However, I am now encountering a problem and I simply can’t figure out what I might be doing wrong:
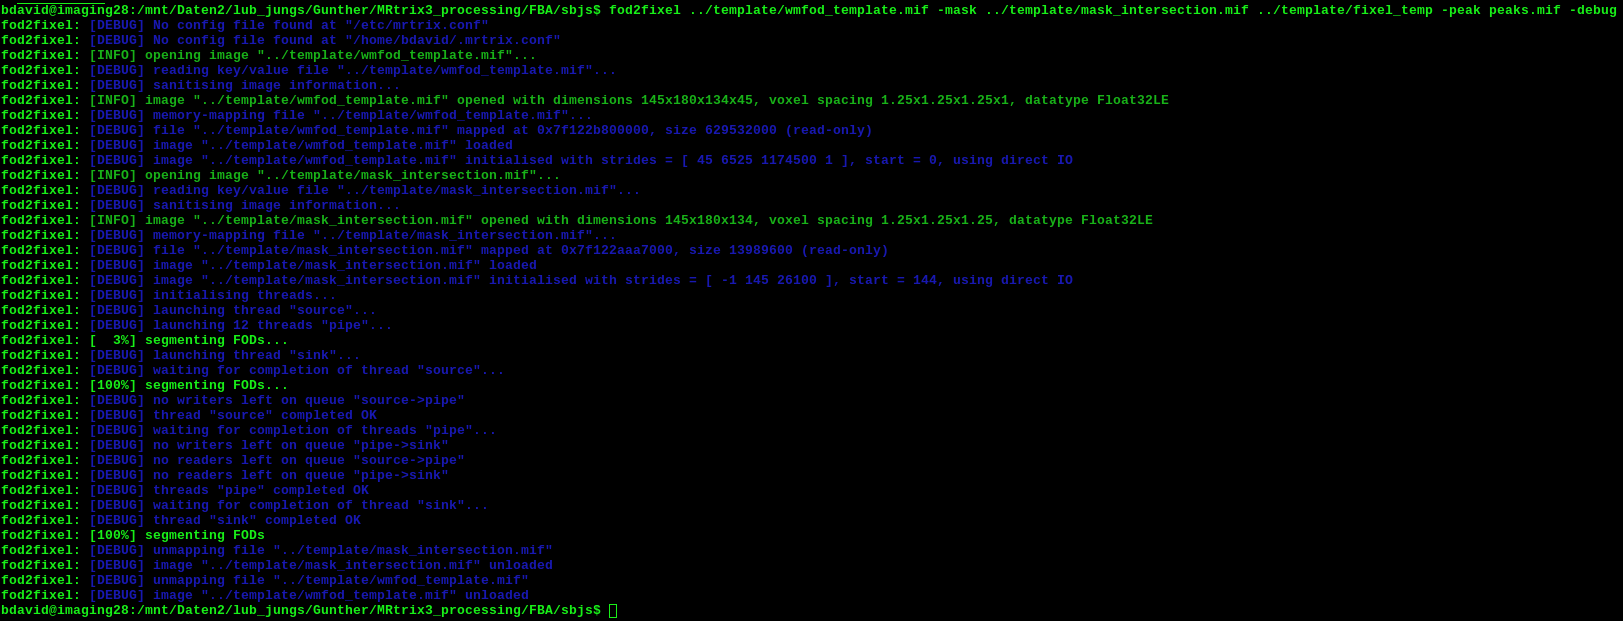
I am trying to create a template fixel analysis mask, as described in the FBA pipeline (step 13). The problem is, that the fod2fixel command does not produce any peak image. I run the command exactly as suggested in the documentation.
Below you find a screenshot of the command and debug messages.
EDIT: In fact I realized, that the FODs that I am producing in the course of the analysis look fine but they have a VERY low amplitude for all subjects and therefore also for the template. Might this be the reason for fod2fixel to fail? Also, what might be the reason for this?
OK, if the issue is low FOD amplitude, that’s more likely to be due to the response function values being too large compared to the signal. This might happen for example if you computed the response function, then performed intensity normalisation, which will change the DW signal amplitudes quite radically, and then used the now incorrectly-scaled response functions in the dwi2fod command. Any chance you could post the full series of commands you used from start to finish…? Or at least until the dwi2fod stage?
I basically followed step by step the FBA pipeline as suggested in the docs (so nothing fancy here). The data is denoised (dwidenoise) and distortion corrected using FSL routines. As I am interested in AFD differences, I corrected for the bias field using dwibiascorrect -ants followed by global intensity normalisation using dwiintensitynorm. After that I just determine the group average response function using dwi2response followed by average_response over all subjects.
The scale factors of the intensity normalisation between the groups do not differ too much, but they range from 2 up to 7 between subjects. Does that range seem too large? I might also need to add, that the dataset comprises of two slightly different DWI sequences (single shell, same b-value, same number of b0’s, same number of diffusion directions), but we already experienced before that there might be a difference in e.g. mean FA-values between the sequences. Therefore we paid attention to have the same ratio of both sequences in our control group as well. Is this maybe problematic for the intensity normalisation?
OK, the main thing I’d be looking out for is exactly what happened between dwi2response and the subsequent dwi2fod using the resulting response. If anything was done to scale either the data themselves or the responses, this might have introduced the problem.
Maybe you can post the contents of your average response file, and the output of:
mrstats dwi.mif -mask mask.mif
where dwi.mif is the same file that you passed to dwi2fod, and mask.mif is your brain mask. That should give us a handle as to whether there is indeed a mismatch.
Could you also state the b-value used, and confirm that these are human in vivo data?
And here you find the output of mrstats dwi.mif -mask mask.mif of the first subject dwi.mif that gets passed to dwi2fod (after dwiextract, so without b0 volumes, as suggested in the docs) :
Between dwi2response and dwi2fod there is actually not much more happening apart from upsampling the data to 1.25 mm (forgot to mention that in my earlier post). The native resolution is 1.7 mm.
I am happy to provide more information if needed, I can also upload the mrstats output of all subjects (they are all very similar though).
OK, that doesn’t look too bad. Slightly surprised to find negative minimum values in your mrstats output, but that might just be due to the upsampling (which was presumably performed using cubic interpolation?). What does the mrstats output look like when applied to the fod image rather than the DWI (within the brain mask once again)? Could you also give us a feel for how low those FOD values are, with a command like this:
And this is the output of the sh2peaks-command above:
first subject peaks
volume       mean     median      stdev        min        max      count
       [ 0 ] 0.00974909 0.00946084224 0.00500929 4.5628e-12  0.0700648     712152
This seems weirdly low, doesn’t it? If I estimate the FODs without bias field correction, global intensity normalization and group average response function (but just use the response function for the respective subject), the output of sh2peaks is nearly 100-times higher.
Yep. Your maximim FOD peak amplitude is 0.07 – below the default 0.1 threshold. Something clearly not right there.
OK, so that at least provides a means of narrowing down the issue. I suggest you look into which steps modify the amplitude of the DW signal (most likely global intensity normalisation, although bias field correction may make a minor difference), and check exactly at what point your response function is estimated at the subject level relative to these steps. My guess is (as before) that you’re estimating the response functions before intensity normalisation, then applying them for the CSD after that step. This would mean that the response function would be scaled appropriately for non-intensity-normalised data, but completely off after than point. I really do think it would help if you could post the exact steps and commands you used in the exact order you ran through them, so that we can double-check all this…
… although bias field correction may make a minor difference
Actually, dwibiascorrect -ants can have quite a significant effect on intensity magnitude: there’s no constraint for the geometric mean of the bias field within the brain mask to be 1. I’ve seen it applying values of ~ 100-300 before. If this factor varies considerably between subjects, and dwiintensitynorm is not used, this could have a significant effect. Have thought about explicitly scaling the bias field within the script after N4 is completed, but seemingly never listed it on GitHub.
Alright, sorry for the late response, your concern about the correct sequence of commands made me doubt myself, so I repeated the analysis steps (until dwi2fod) again. I also noticed two control subjects behaving weirdly during registration so I excluded them for now. I followed meticulously the pipeline as suggested in the docs.
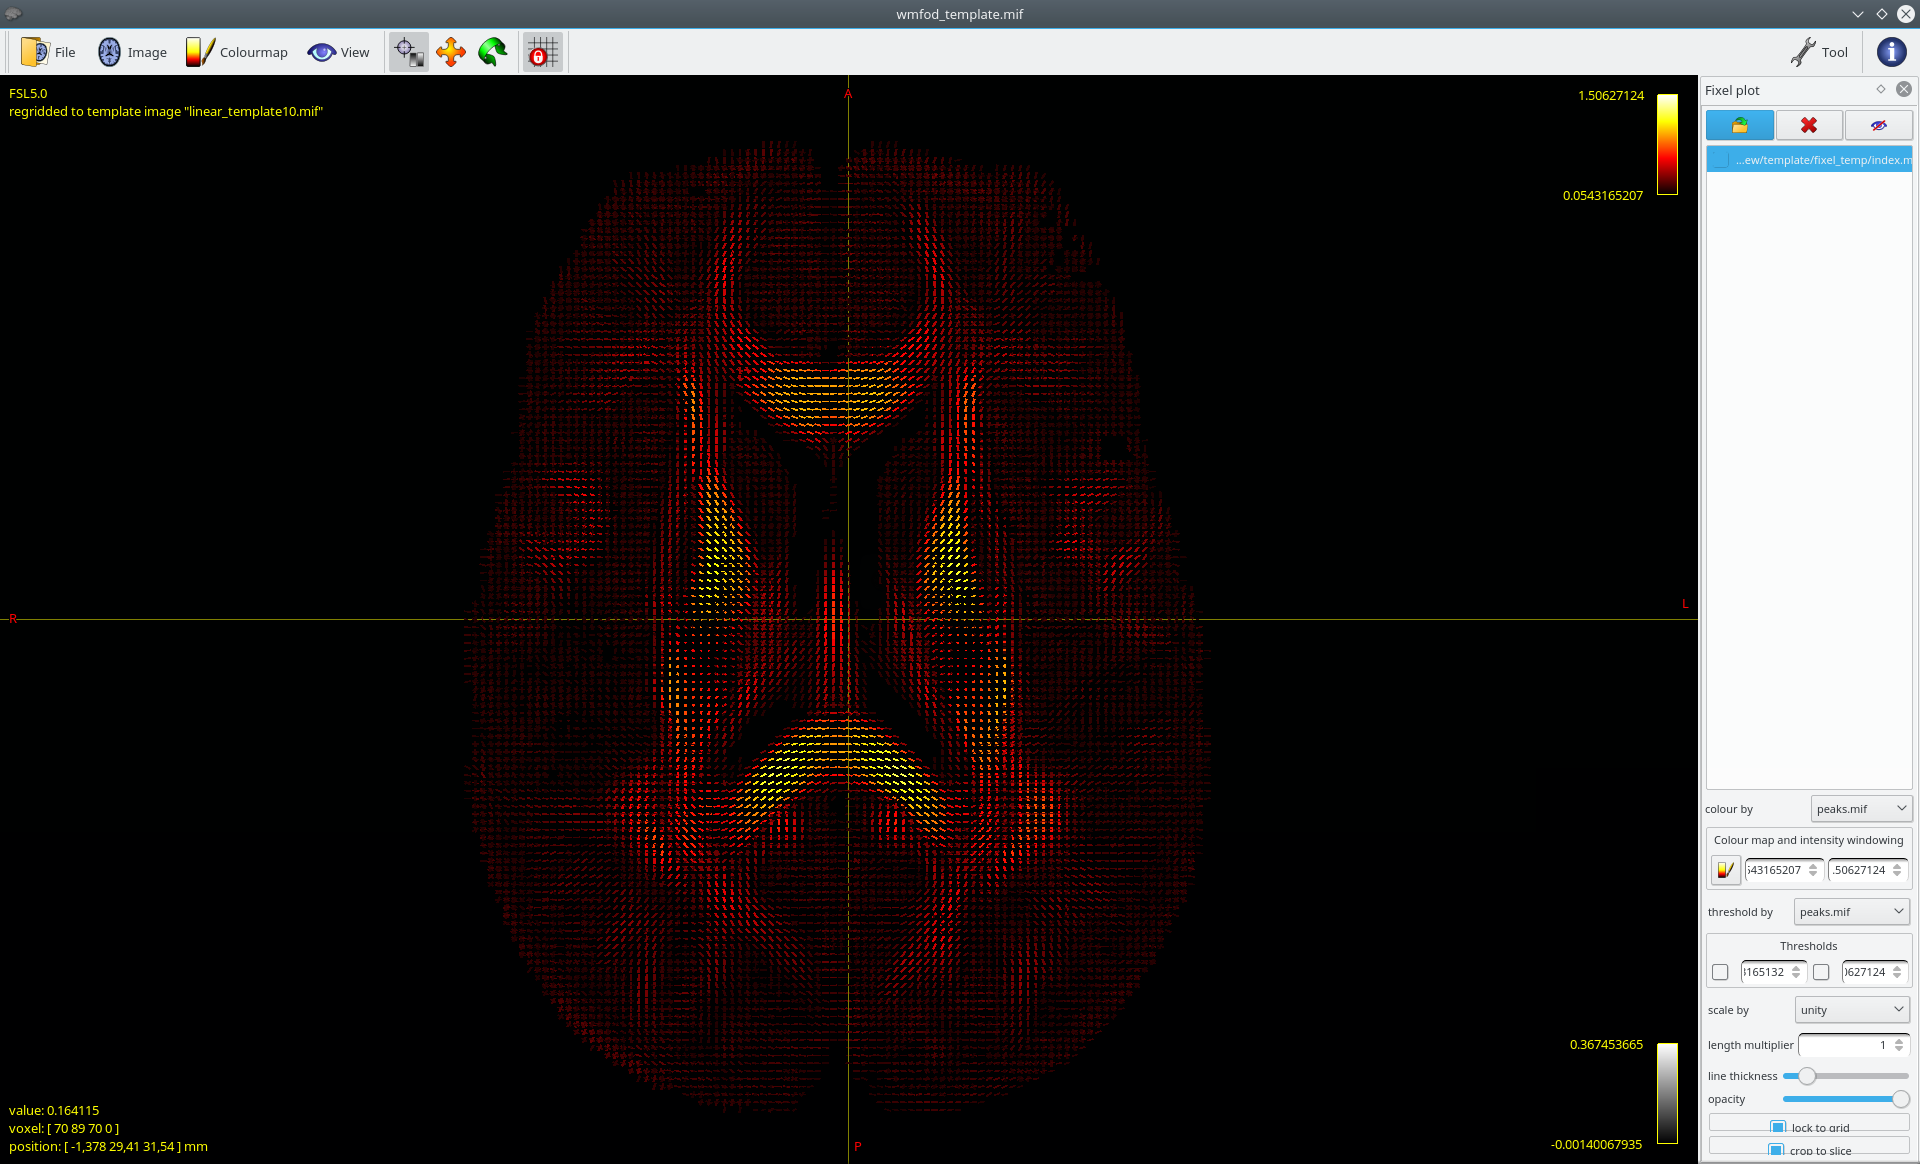
Again sorry for the late reply, the creation of the population template took quite a while. I produced the template now and was finally also able to create a template AFD peak fixel image, that looks reasonable: