Dear experts,
I’m a beginner of MRtrix and dMRI.
I want to visualize connectomestats in a group template.
First, I follow Andy’s Brain Book to generate all subjects’ connectome individually. BTW, I use the same response to generate FODs, then execute mtnormalise and SIFT2 before execute tck2connectome.
After acquiring all subjects’ connectomes, I execute connectomestats.
I try to use mrview to show the result (fwe_1mpvalue.csv) in subject001.
I think that I should have a group T1 template and group connectome to show fwe_1mpvalue.csv, so I generate a T1_template.nii.gz from this command:
population_template ./T1_raw/ ./T1_template.nii.gz -voxel_size 1 -mask_dir ./T1_mask/
and it works well.
I try to generate group connectome according to the previous steps to generate the connectome of indivudual subjects. So the next step is generating the boundary. I type this command:
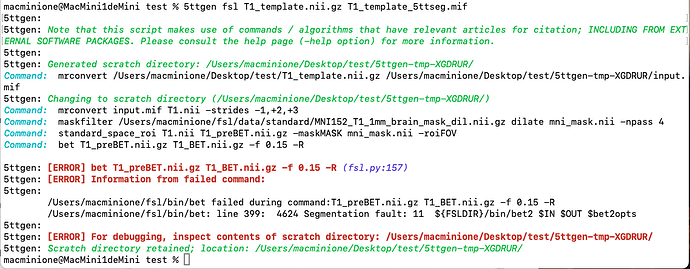
5ttgen fsl ./T1_template.nii.gz ./T1_template_5ttseg.mif
It does not work.
Here is the error output:
I use mrview to view T1_preBET.nii.gz, its interp values are 0.
Can someone help to fix this problem? Or I have some misleadings. Again, my purpose is to visualize the results of connectomestats in a group template.
Thanks a lot.
Best Wish,
Vivian
