This is not a topic post about MRtrix3. To be precise, it is more related to Python. Because I am a Python user, I hope that most of the work can be done by Python.
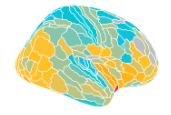
I want to plot a figure like the one below (I know MRtrix3 can do this too). There is an underlay for the brain surface, and then there is an atlas as an overlay. Each brain area in the atlas can be colored to represent the magnitude of the value.
So is there a python package that can easily do this? I often need to perform some analysis on macaque neuroimaging, so I would like this package to be able to customize the atlas files used.
I hope you can give me some suggestions. And if I want to do this, what file formats do I need? And if you have a tutorial, please!
I noticed that this tutorial seems to be using the BrainSpace package for drawing.
In fact, I have tried using plot_hemispheres and plot_surf in BrainSpace to draw pictures.
But it often appears in infinite loops, and finally I need to restart the jupyternotebook kernel. I couldn’t find the reason so I gave up on it (maybe it has something to do with VTK, I don’t know).
I just discovered that the plotting functions in the MNE package might be able to solve my problem.
That is cool. Thank you for sharing MNE with me.
I encountered the same issue on Windows, but not Ubuntu. I usually solve this problem by setting arguments screenshot and filename which will just save the pictures without viewing in an OpenGL window.