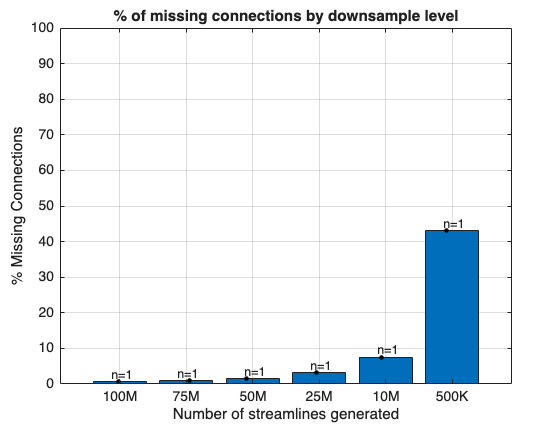
Dear MRtrix3 team and @rsmith,
I realise i am not the first person to recently ask about interhemispheric connections, but I’d be grateful for your thoughts on an issue.
I have a moderately sized cohort of older adults with cerebral small-vessel disease and an age-matched group of healthy controls. Using MRtrix3, I performed probabilistic tractography between 200 x 200 Schaefer-atlas–derived ROIs, keeping all processing in native DWI space (code:
However, I’m observing substantial variance across participants in the number of ROI pairs for which no streamlines can be generated, see graph. My understanding is that when tckgen cannot generate a streamline, it simply records a count of zero, so I’m puzzled by the wide inter-subject differences in cases where tractography fails to place a streamline.
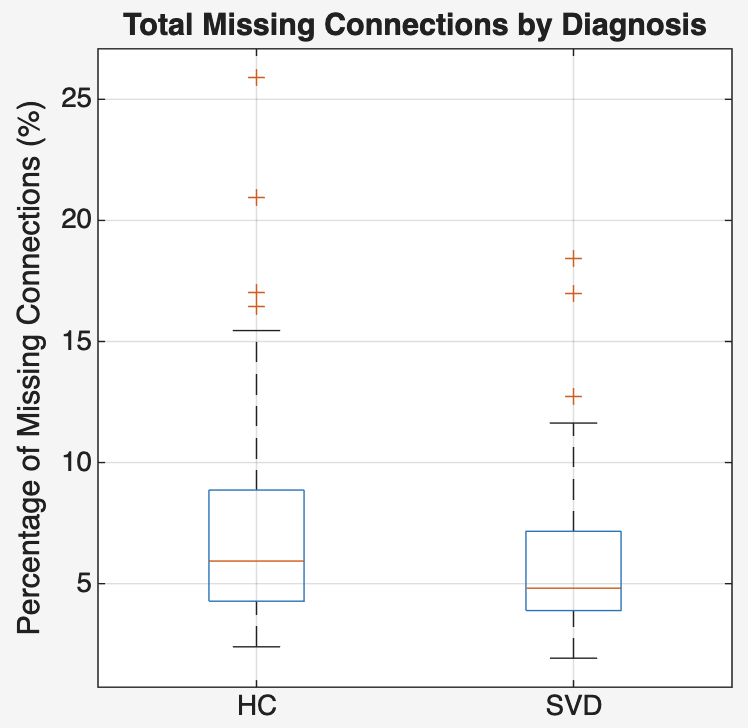
Figure 1. The number of ROI-pairs (%) where tckgen could not place a streamline for each clinical group.
Most missing connections appear to be inter-hemispheric, to take a snapshot of my volunteers:
| ID | Diagnosis | % Missing streamline | Of those, % inter-hemispheric |
|---|---|---|---|
| 1 | HC | 2.77 | 72.78 |
| 2 | HC | 7.46 | 89.09 |
| 3 | HC | 6.92 | 88.67 |
| 4 | HC | 5.68 | 88.67 |
| 5 | HC | 7.17 | 94.18 |
| 6 | HC | 4.70 | 83.01 |
| 7 | HC | 5.80 | 86.84 |
| 8 | HC | 7.51 | 79.06 |
| 9 | HC | 15.45 | 85.72 |
| 10 | HC | 7.52 | 86.76 |
| 11 | HC | 16.46 | 84.27 |
| 12 | HC | 4.38 | 86.01 |
| 13 | HC | 5.97 | 86.29 |
| 14 | HC | 25.88 | 90.45 |
For participant 14 (25 % missing connections) I re-ran tckgen with the -info flag; the termination statistics are below:
tckgen: [INFO] Maximum truncation error      = 1.595...
tckgen: [INFO] Total number of terminations  = 40,940,512
tckgen: [INFO] Termination reason probabilities:
  Entered cortical GM               59.3 %
  Calibrator sub-threshold          14.4 %
  Exited image                       0.29 %
  Entered CSF                        0.06 %
  Diffusion model sub-threshold      0.005 %
  Excessive curvature                0 %
  Max length exceeded                0.10 %
  Terminated in subcortex            9.85 %
  Exiting sub-cortical GM           16.0 %

Track rejections:
  Invalid seed point              568,290
  No propagation from seed              17
  Shorter than minimum length   9,104,102
  Longer than maximum length        40,143
  Poor structural termination    5,466,912
  Failed to traverse WM            567,831
Is it a registration issue? I preprocessed my data using the HCP pipeline through QuNix and applied the Schaefer atlas in surface space, and then registered it to DWI space to run tractography. To take the example of the participant with the most missing streamlines (subject 14), the registration looks fine.
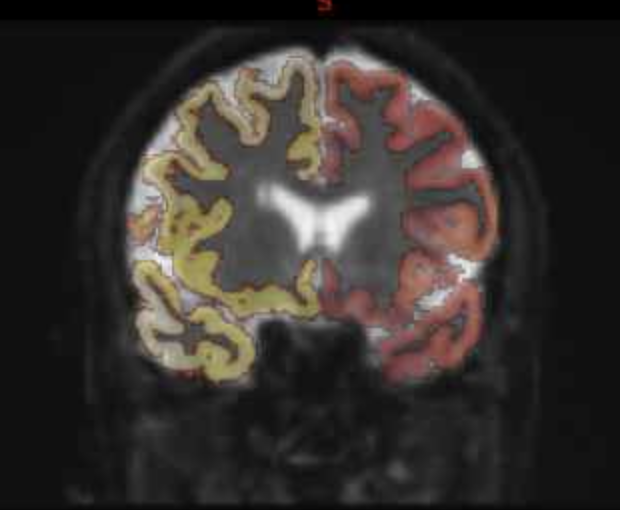
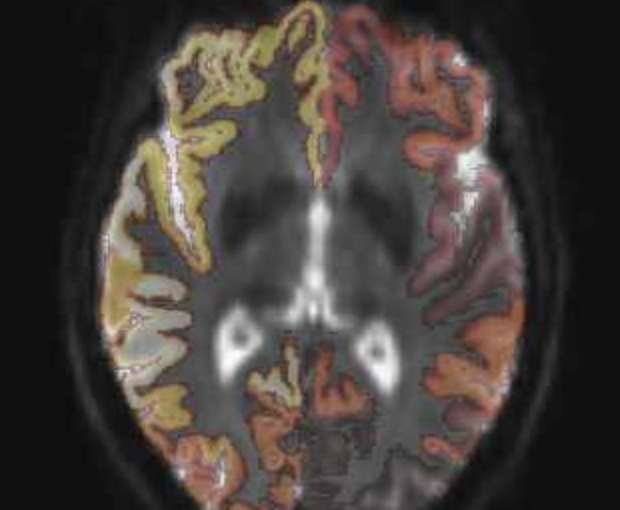
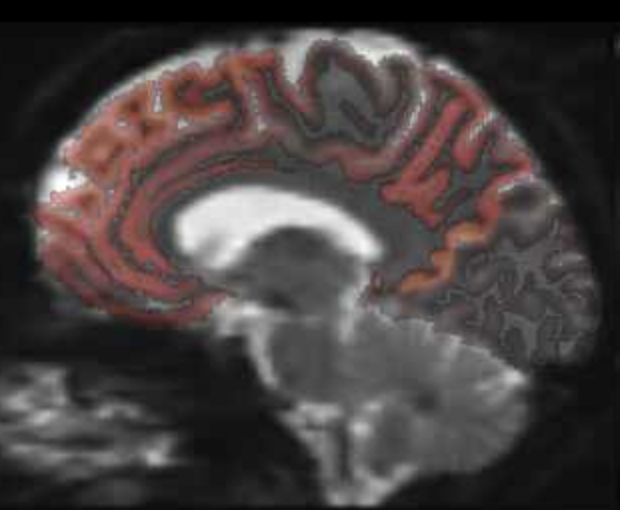
Figure 2. Schefer atlas parcellation overlaid on mean b0
Is it due to Fiber orientation distribution being off? Again, in the same subject, it seems like the FODs follow the expected direction, and the tractographpy seems to look ok.
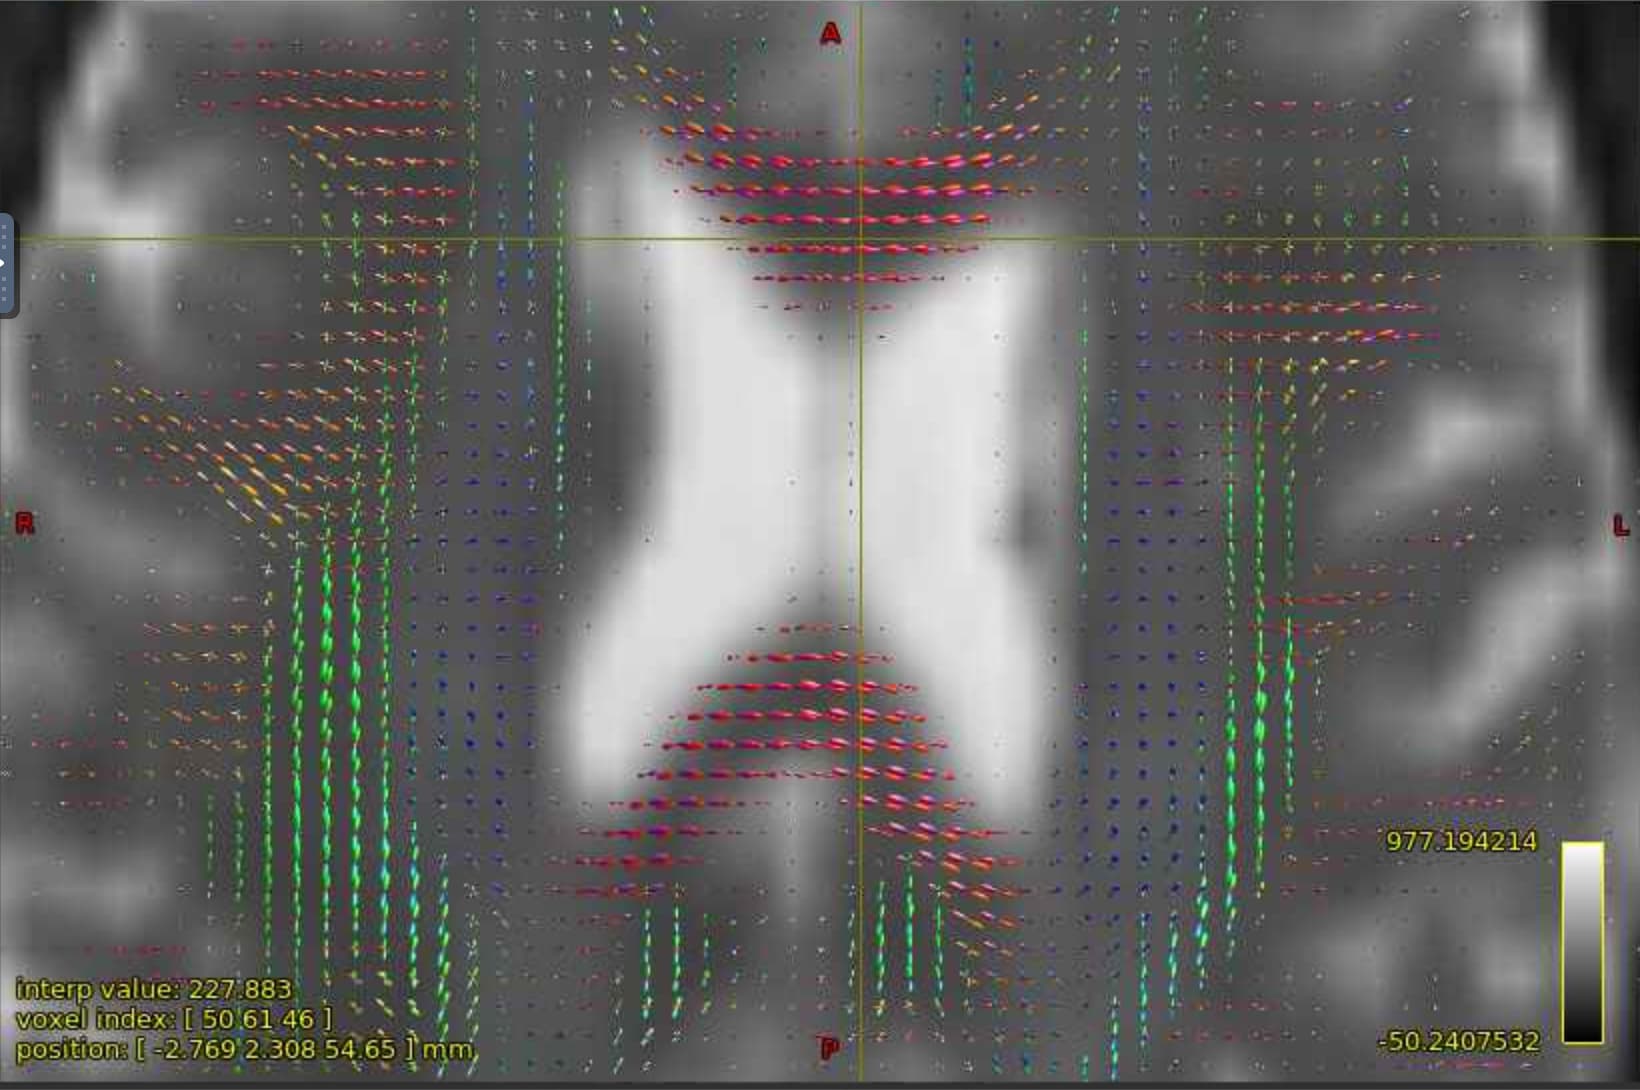
Figure 3. FODs overlayed on mean b0
White matter mask seems fine, although I haven’t tried using the fsl flag, currently 5ttgen uses hsvs.
I would be extremely grateful for any advice. If there is anything more that can be done to help diagnose what may be happening, please do let me know.