Hi @Jallyson,
This question actually relates directly to some of the work I’m doing myself at the moment. While I’m looking forward to bringing revised FBA advice to the community, I can’t quite show all of my cards right now. But I’ll give what feedback I can.
In my preliminary whole-brain FBA results, it showed reduced FD without FC changes in specific tracts.
The first thing to be aware of is that there are two thresholds being applied here, which has the potential to mislead. While it is strictly statistically correct to state that “there are FD reductions but no change in FC” if pFD=0.049 and pFC=0.051, the same statement would equivalently hold for pFD=0.001 and pFC=1.0. So in trying to better understand what’s going on in your data, you might want to interrogate the data in more detail than just the outcomes of p-value thresholds.
There were also regions showed reduced FDC (which partially overlapped by the significant results of reduced FD) but the area of FDC reductions was smaller than that of FD.
Moving from FD to FDC includes not only any effect in FC that is concordant with the effect in FD, but also the variance within FC. So if the spatial extent of statistical significance is smaller in FDC than FD, that would suggest that one of the following is true:
- There’s no effect in FC;
- There is an effect in FC, in the same direction as FD, but it’s overwhelmed by the contribution to variance from FC;
- There’s an effect in FC in the opposite direction to FD.
I suppose the change of FDC is mainly attributed to reduced FD, is this speculation appropriate?
To me, this is what’s fundamentally of interest in the interpretation of FBA results using the standard metrics. This is why I proposed the metric described in Section 2.3 of this manuscript, which to me yields the same conclusion as you state here, but in a more direct manner:
http://www.sciencedirect.com/science/article/pii/S1053811920309903
For the scenario of reduced FD without FC changes, I consider the underlying microstructural pathology of crossing fibers is the axonal loss of fibers of a specific direction/orientation.
Without longitudinal data, I don’t think that the effect can be strictly attributed to axonal loss. The most basic interpretation is “less axons”, but with all of the caveats of FD quantification (T2 sensitivity, axon count vs. axon diameters, diffusion-weighted signal attenuation for very large axon diameters despite large intra-axonal volume, difficulties associated with global intensity normalisation).
(1) In stroke patients, there is axonal loss of specific tracts?
(2) There are associations between impaired behavioral scores and axonal loss ?
As long as you are comfortable assuming that it is not the case that healthy subjects with lesser WM fibre density are more susceptible to stroke. 
“Correlation doesn’t imply causation, but it does waggle its eyebrows suggestively and gesture furtively while mouthing ‘look over there’.” (credit)
Q3: Can reduced FD without FC changes be interpreted as “axonal loss”? Is it necessary to have FC reductions when accurately interpreting reduced FD as “axonal loss”?
I don’t think so: as per the figure you copied, if there’s a loss of axons without subsequent atrophy, then FD will decrease but FC will not change. The question is what are the biological circumstances in which such morphological atrophy does or does not occur, as well as the time frames over which such occurs; and I personally share your interest in getting reliable information on such.
Some researchers may doubts the interpretation of this scenario. They think it is inaccurate to refer FD as being “proportional to the within-voxel number of axons” and interpret FD reductions as reflecting “axonal loss”. They consider FD is related to the radial diffusion signal contribution or intra-axonal volume of a given fiber bundle. It captures information about number of axons, axon density, axon volume, and factors that affect the radial diffusion signal contribution, such as myelination; reduced FD may reflect axonal loss, but it is likely the wrong interpretation given the authors found no reduction in FC, which would be expected to decrease with axon loss.
So this requires a bit of unpacking.
-
The statement:
"FD as being proportional to the within-voxel number of axons”
is an imperfect simplification of the statement:
“FD is related to the radial diffusion signal contribution or intra-axonal volume of a given fiber bundle. It captures information about number of axons, axon density, axon volume”.
I don’t think the team would argue with the latter definition, though it is perhaps a little imprecise (e.g. exactly what “axon density” is and how it is different to count / volume). We have always been wary of referring to FD as being directly proportional to axon count, and have preferred to speak in terms of intra-axonal volume, based on the AFD simulations way back in 2012. In the context of FBA utilising both microstructural and morphological measures, sometimes discussion of the differences between these metrics will take precedence over being faithful to the nuances of what gets measured using FD. But yes, theoretically at least, there can be axon loss with no change in FD (e.g. remaining axons are larger in diameter), and there can be a change in FD without axonal loss (e.g. all axons grow / shrink in diameter); unfortunately we have little ability to disentangle such with our current DWI data / modelling approach.
-
We would probably push back against “… the radial diffusion signal contribution, such as myelination”. We often cite this reference as proof that the presence of myelin is not necessary for intra-cellular diffusion restriction. Moreover, for water-bound myelin, the TE is so short that it is essentially invisible at the long TE’s involved in conventional DWI, such that at high b-values the volume of the voxel occupied by myelin is indiscriminable from extra-cellular water.
-
“reduced FD may reflect axonal loss, but it is likely the wrong interpretation given the authors found no reduction in FC, which would be expected to decrease with axon loss” is predicated on morphological atrophy being guaranteed following such loss. While we had hypothesized that this would be the case more often than not, we have certainly seen disease cohorts where there is decreased in FD throughout much of the brain WM yet no decrease in FC, suggesting that in the steady-state the WM occupies the same volume as a healthy individual but supports a reduced intra-cellular volume fraction.
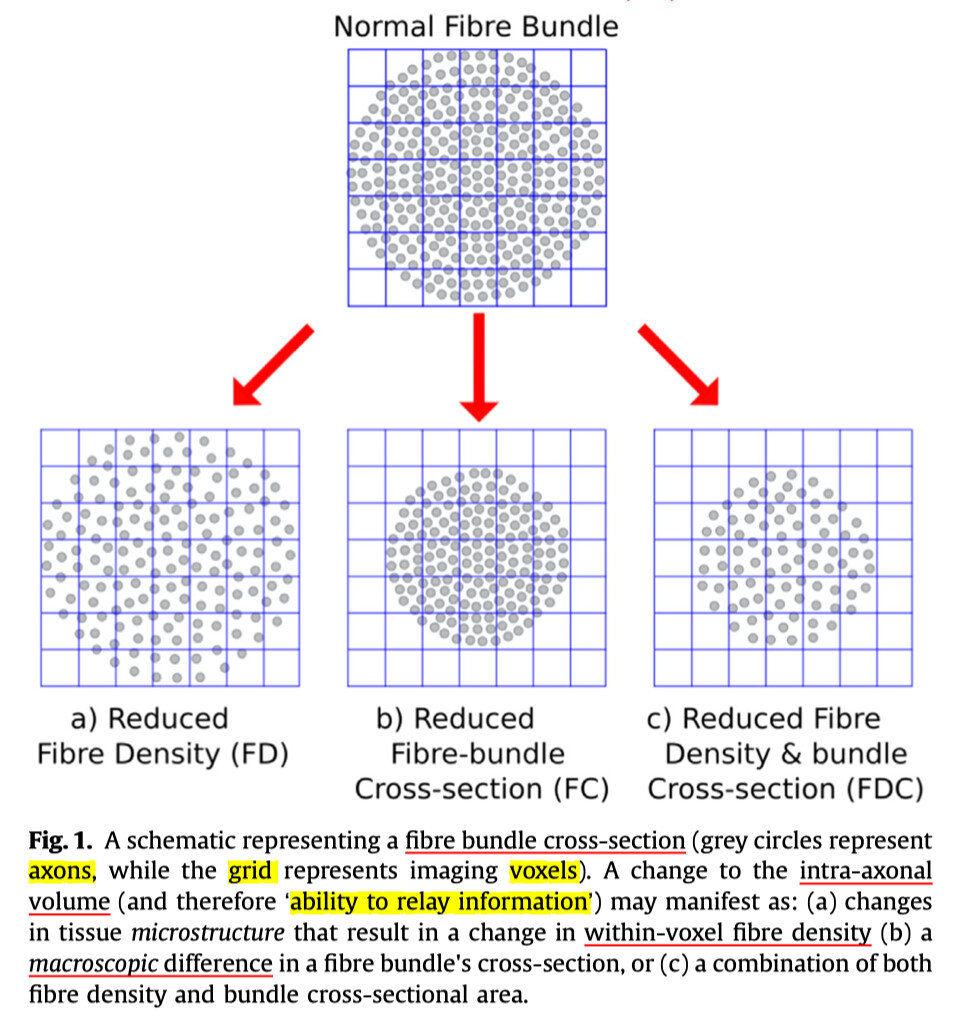
Moreover, also in Raffelt et al., 2017, Fig. 1a shows reduced FD. It interprets reduced FD is following axon loss,
I think this might be putting the cart before the horse. The example shows an example where there is axon loss, resulting in a reduction in FD. It makes no claim about this being the only mechanism by which the measured FD may decrease. As mentioned previously, when the conversation pertains to the difference between FD and FC, the nuances of the behaviour around FD can be omitted.
Therefore, according to this article, it seems that there is no evidence that only FD and FC reduced at the same time can reflect axonal loss.
I don’t think there is any claim that this is the case. Is there any quote that you can point to that claims that an interpretation of axon loss can only be applied if both FD and FC are reduced?
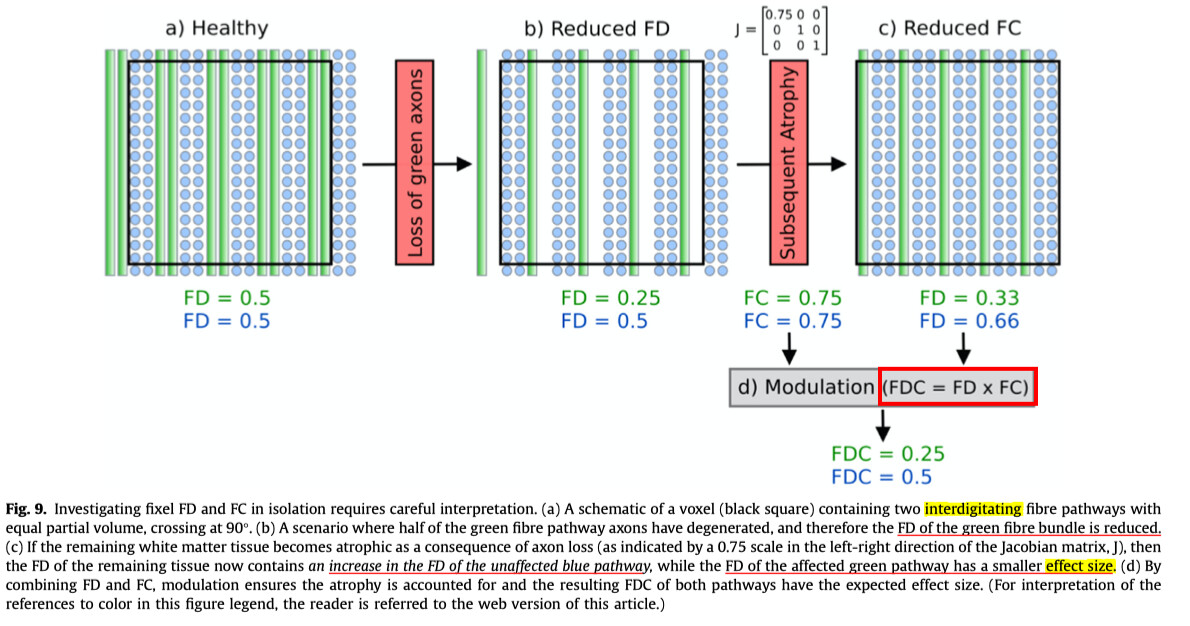
It’s possible that this may be a misinterpretation of Fig. 9. If you were to begin with the premise that what is shown in that figure is the only possible manifestation of axonal loss, then you could conceivably then argue from that point that it has not been proven that there are other manifestations of axonal loss that fail to result in decreases in both FD and FC. However that is not the purpose of this figure. As stated at the start of the figure legend, its purpose is rather to show that if you interpret either FD or FC in isolation then the outcome of such may be misleading.
Given that my cohort is subacute stroke patients, it seems appropriate that fibers of subacute stroke only show FD reductions without subsequent FC reductions; FC might subsequently reduce in the chronic follow-up. However, in the current cross-sectional study, do you consider my interpretation of the results appropriate?
It would seem reasonable to me; but as mentioned above, I’ve not personally extensively researched the time frames associated with the breakdown and clearing of truncated cells or how long it may take for the loss of axons to lead to morphological thinning.
In the Fig. 9 (as shown below), Panel b) shows reduced FD of green fibers but without FC changes, and the left red box interprets the change as loss of green axons. Does Fig. 9 support my interpretation rather than the researchers opinion?
In retrospect there’s an important message missing from this figure. If one were to calculate FDC on the data after loss of green axons but prior to subsequent atrophy, then the FDC values are equivalent to those shown following the subsequent atrophy. This demonstrates how FDC is reflective of the total capacity of the white matter to relay information, whereas FD and FC if interpreted individually can be misleading in some scenarios (which is the actual intent of this figure as mentioned above).
Cheers
Rob
 Is it necessary to have FC reductions when accurately interpreting reduced FD as “axonal loss”? I’ll appreciate it if you spare your time to solve this problem.