Dear experts,
I’ve been having some difficulty interpreting FBA outputs, especifically abs_effect.mif and fwe_pvalue.mif. I am working on two sets of data ( patients x controls ), investigating group differences with the Multi-tissue CSD pipeline. Mrcalc command generated percentage_effect.mif files for each contrast and Fixel2tsf command generated fdc_fwe_pvalue.tsf and fdc_abs_effect.tsf files in order to display results with streamlines.
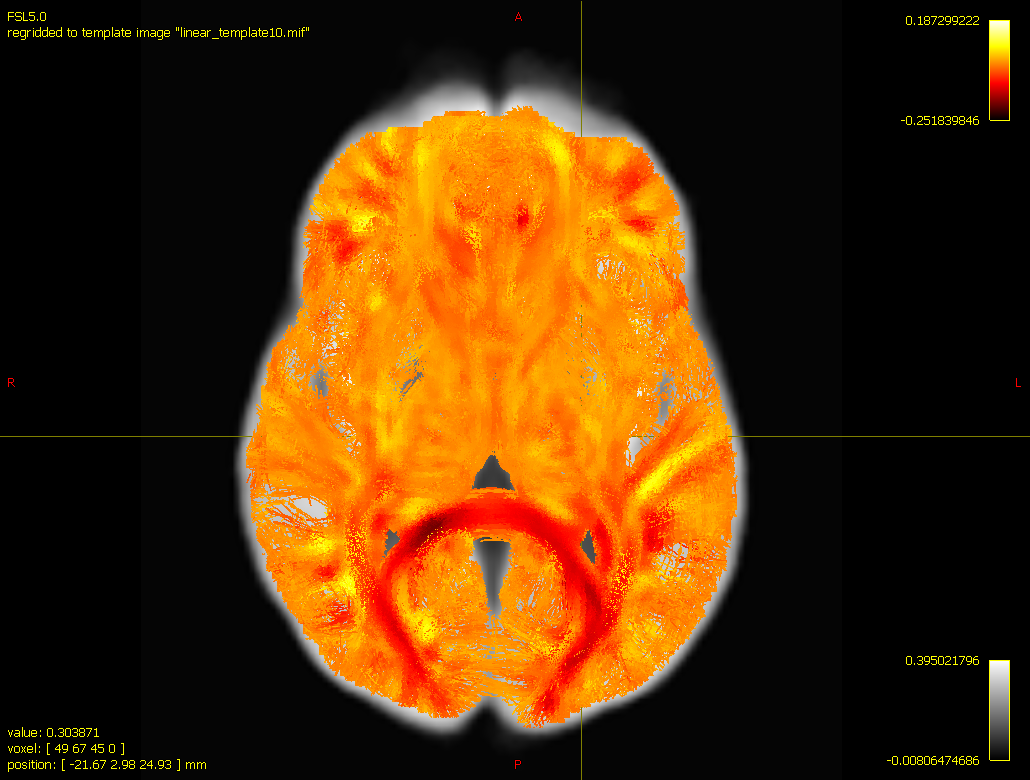
In order to visualize the results, I’m opening a track file with 200k streamlines in the tractography plot tool. On the scalar file option, I’m opening fd_percentage_effect.tsf, with the results displayed below:

Whenever I run abs_effect.tsf file in scalar file options, the results are quite similar from the image above:
The regions displayed in different color ( mainly the splenium of the corpus callosum ) are in accordance with our hypothesis, but when I proceed to threshold the image with fwe_pvalue.tsf (0.95 value in the the value box on the left hand side), the results are completely gone and no streamlines are generated.
I hope someone can help me understand the meaning of the output generated with FBA ( abs_effect.mif, fwe_pvalue.mif), mrcalc (percentage_effect.mif) and fixel2tsf (fdc_fwe_pvalue.tsf and fdc_abs_effect_size.tsf) and how to use these files to make sense of my results.
Thank you!