Hi Thijs
Thanks for the explanation.
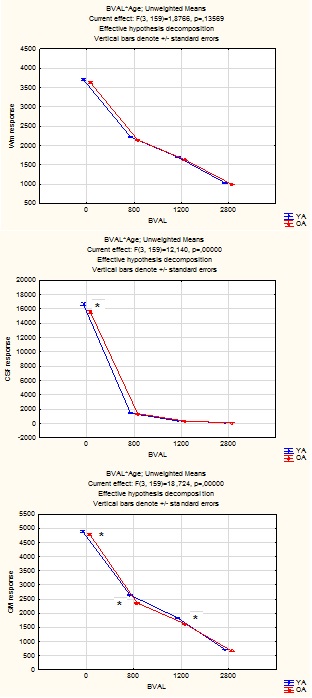
Here is the outcome of applying your algorithm to the intensity normalized DWIs (across all subjects using dwiintensitynorm) for a sample of 30 Young Adults (YA) and 27 Old Adults (OA):
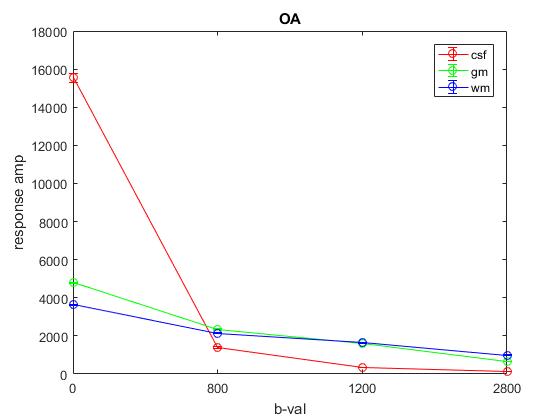
1) OA example:
WM response:
3558.514267251221 0 0 0 0 0
2098.960405698456 -562.8884179939862 87.42229861510899 -16.1008943696647 -3.404349856291478 -27.54914734197291
1631.736727070469 -664.1430944400951 174.9579915869785 -29.85632571483947 5.156498720614587 2.389530365950526
976.6217962898037 -598.9877074581515 285.7765430076679 -103.2611435214982 27.78032538379087 -4.09857207357174
CSF response:
16665.87786826252
1628.787969076357
382.6316718400435
109.395486221678
GM response:
4904.964072158946
2399.917058262798
1647.274519987118
657.1604089131876
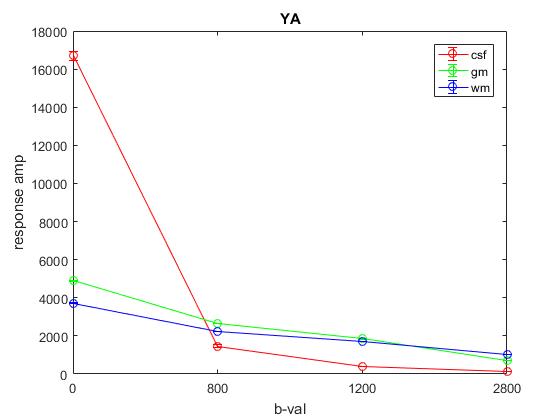
1) YA example:
WM response:
3686.198042680062 0 0 0 0 0
2204.967027951133 -553.4787650069316 66.02828713310667 -10.51178782827822 -0.9376398524498114 -14.61632118314774
1698.439514893548 -658.2545210184219 149.9362405403081 -26.84502975330937 5.084326700209281 -0.9259074351671007
1019.055173983989 -621.7368580808204 267.9919349050045 -82.81758720253806 16.47263607548521 -4.149395477210142
CSF response:
15390.44616089431
1780.179435284597
381.0021403728388
63.85700740204156
GM response:
4892.806584867702
2585.051176312267
1807.91729561205
727.2326239360207
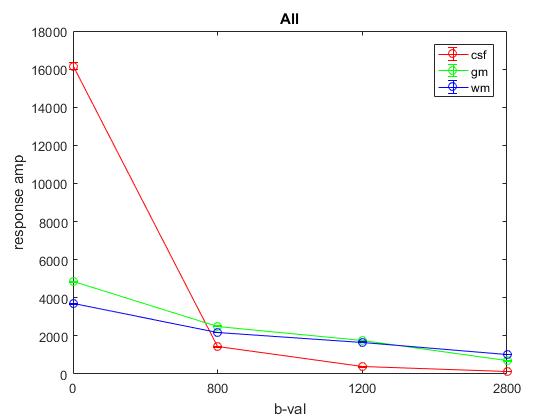
Average across all subjects:
WM response:
3673,78246518564 0 0 0 0 0
2187,96829458079 -581,806313823357 82,9272268496216 -10,0882006049367 -1,62410147212965 2,33733880521584
1669,43229520527 -689,944617246396 170,043848731565 -28,7063852687714 3,53444622956215 -2,20799462390421
1011,47705505164 -641,201831299893 293,104616514553 -98,9208818298173 24,7964657673854 -5,90174651986964
CSF response:
16151,2721783807
1423,64195274047
367,704621584411
128,759910841613
GM response:
4844,38733085823
2508,82026184851
1738,23882951545
687,026390155180
Plot of average response (1st column) across YA:
Plot of average response (1st column) across OA:
Plot of average response (1st column) across All:
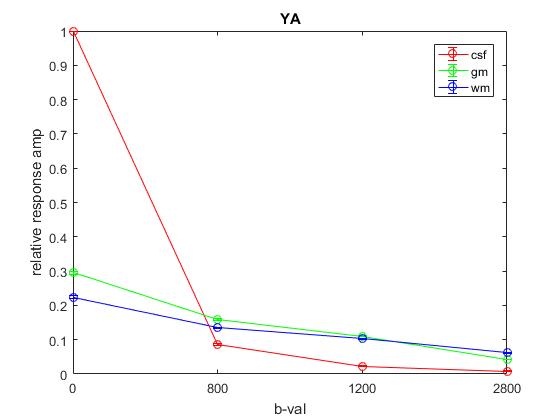
Plot of responses normalized to CSF(1,1) averaged across YA:
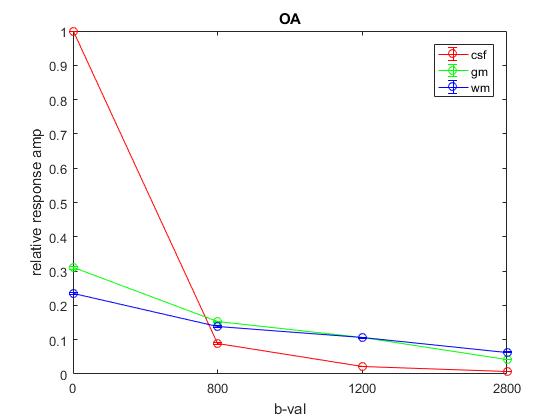
Plot of responses normalized to CSF(1,1) averaged across OA:
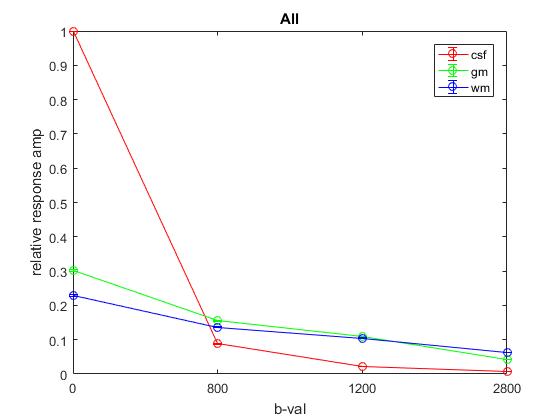
Plot of responses normalized to CSF(1,1) averaged across All:
TissueRGB for the exemplar old adult using subject and average (across all) response:
Do you think they look fine?
Please let me know if you need more info/outcome.
Cheers,
Hamed