I would like to use mtnormalise for intensity normalisation of my (brain tumor and healthy control) subjects. I ran the following command as suggested:
The command runs and produces results, which seem fine for the GM and CSF, but for the WM the result looks a bit weird and the mask seems not to have been taken into account.
To get to the input images, I tried running dwi2response and dwi2fod both on the distortion corrected images (dwi_distcor.nii; corrected for eddy currents, motion, bias field), and on the distortion corrected + intensity normalized (using dwinormalise) DWI images (dwi_norm.nii), but the results are the same.
All data and pictures can be found via this link: https://www.dropbox.com/sh/w08f0wwqywvhzz6/AAAMQQfiu-vqzHb8N95yBZrma?dl=0. Could someone indicate whether this is normal or what went wrong?
Also, I was wondering how I’d have to proceed in order to average the individual response functions. Should I rerun dwi2response to obtain new response functions (per subject) with the normalized tissues? And what would then be the input for dwi2response?
Sorry for the incredibly late reply, but here goes something: yep, that does look a bit weird. You can avoid this by running the multi-tissue CSD itself already with a -mask, so the background becomes essentially zero after that. This avoids the mtnormalise factors also being applied to a noisy background. Essentially, as long as you stick to the brain area itself, there shouldn’t be any problems. Be assured that mtnormalise only uses the voxels in the mask area to estimate the normalisation field. That’s exactly the reason why, beyond that mask, the estimated normalisation is a non-nonsensical extrapolation of the one estimated in the brain mask.
Not needed. Just get the response functions once of all subjects before CSD, and average those, and then use those averaged ones consistently for all subjects. Even if scaling is still a bit off before intensity normalisation, that’s not a big concern: these responses typically only vary very little between subjects. The averaging is really only there for elegance, and potentially to correct things a bit in case a single subject has slightly wonky response functions. If you’re studying a particularly weird/global pathology, you may be slightly safer by only using the response functions from the healthy subjects and averaging those.
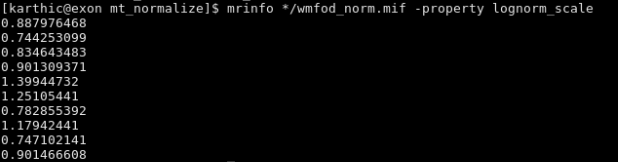
Nothing to worry about per se: this may just be mtnormalise doing its job very well, and correcting for global intensity differences in your data at that stage. These may originate from your acquisitions itself, but in fact also be introduced by dwibiascorrect, if you used that step. The numbers you show aren’t completely different orders of magnitude (that would in fact be a bit strange/worrying), so this just looks like mtnormalise kicking ass as it always does.
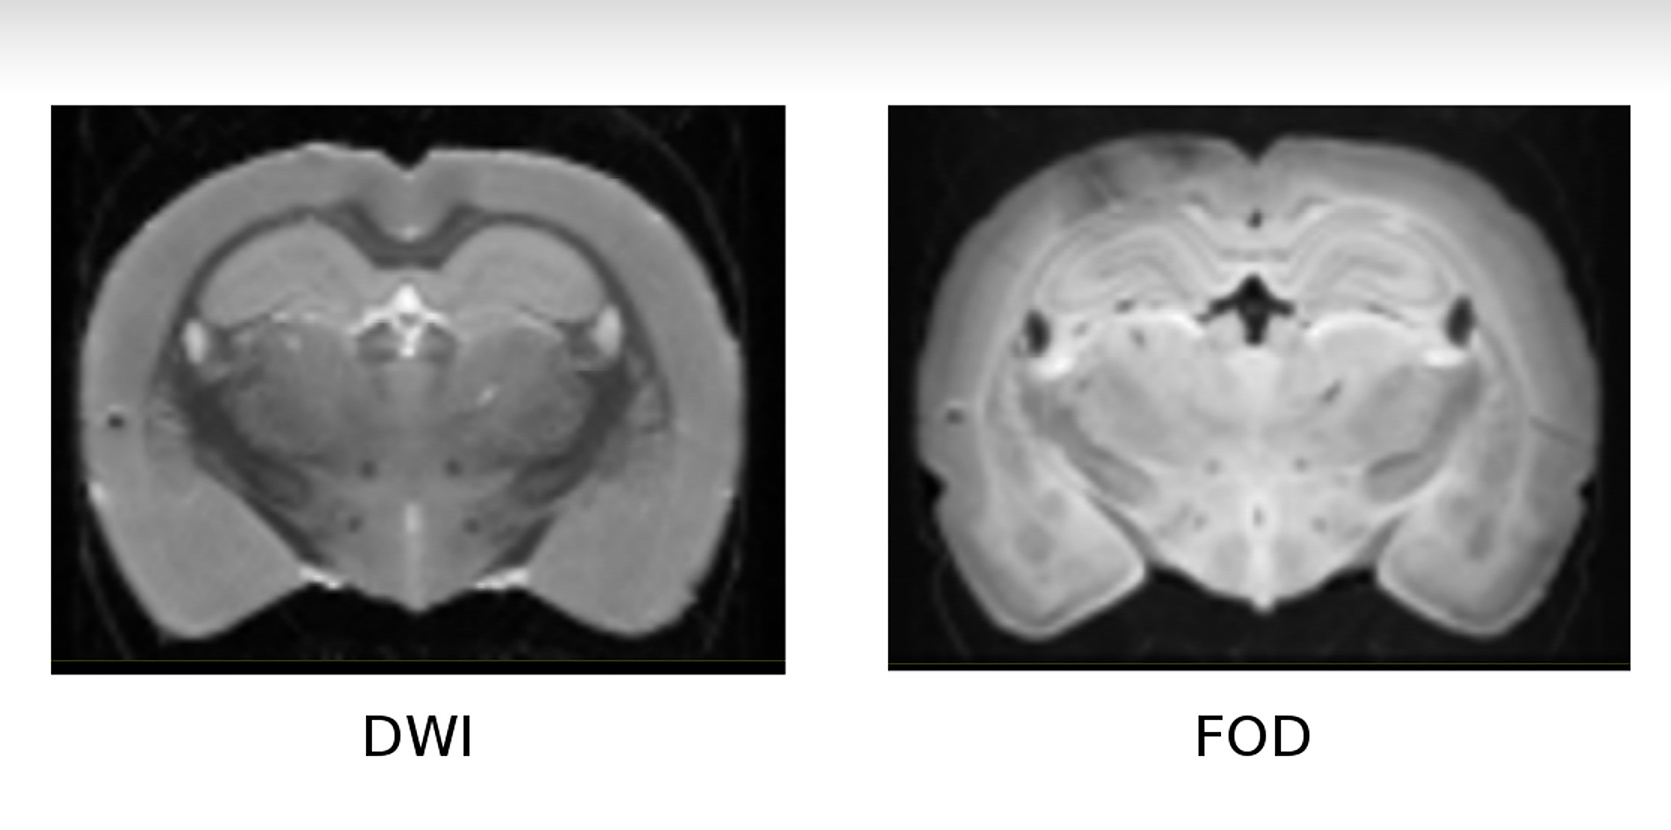
Well, this is something genuine in your rat… Definitely not an artefact of any method (e.g. the multi-tissue CSD). Careful when you say it’s just “some voxels”, which sounds like a local “dot” of sorts. Don’t forget you’re looking at a slice through a 3D object. It may help to scroll or look at other views to identify the shape of the thing. What you labelled as “DWI” looks like the b=0 image though (I note high intensity in the ventricles). Looks like an area of low signal there… could be some iron (content?)… SS3T-CSD could potentially give me further insights… But even there, it’d look like a “darker” area. But the tissue-nature of it. or the voxels immediately adjacent to it, may give further insights.
Have these rats been injected with something in their brains at some point? Or has a biopsy been taken? Or an electrode stuck in (even if pulled out later on)? I can’t imagine an air-bubble or something otherwise…
Although, while I’m rambling away with ideas, maybe a (micro) bleed could be another potential explanation.
But as you can tell, I potentially just guessing away here…
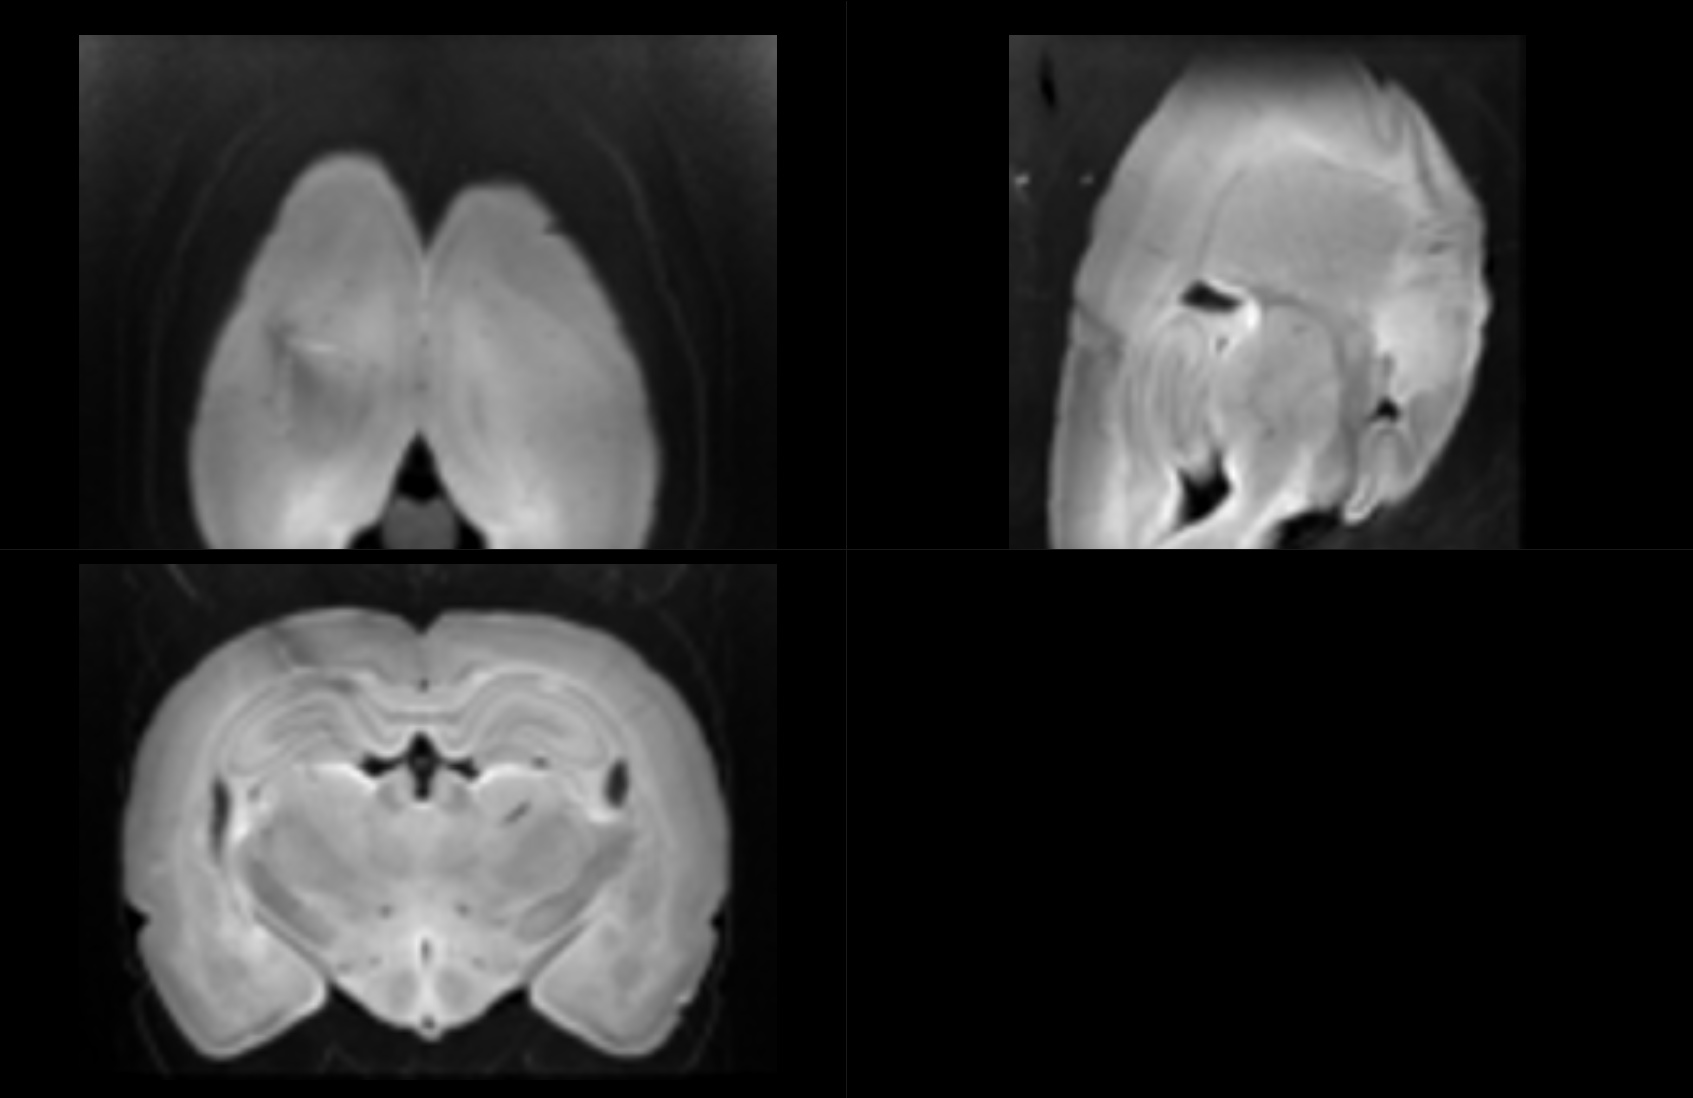
Aha, it’s the bit at the top. I was distracted by another feature on the left side (of the figure) in your previous post, but now I see what you were referring too. That’s quite an interesting bit, because it does not show decrease in the b=0 signal. I suppose in your 2-tissue CSD, you could potentially see an increase in CSF-like signal there, which may be caused by the surgery, that complements the decrease in WM-like signal.