Dear MRtrix’ers,
I’m working on HCP data, closely following the Nature Protocol paper:
- Calculate tissue-specific response functions using
dwi2response dhollander. - Average response functions across subjects using
responsemean(since I’m interested in comparing connectomes across subjects, I decided to use the average response functions). In fact, just for testing I used the average response over 10 subjects. - Estimate the ODFs based on the average response functions using
dwi2fod msmt_csd. - Normalize the ODFs using
mtnormalise.
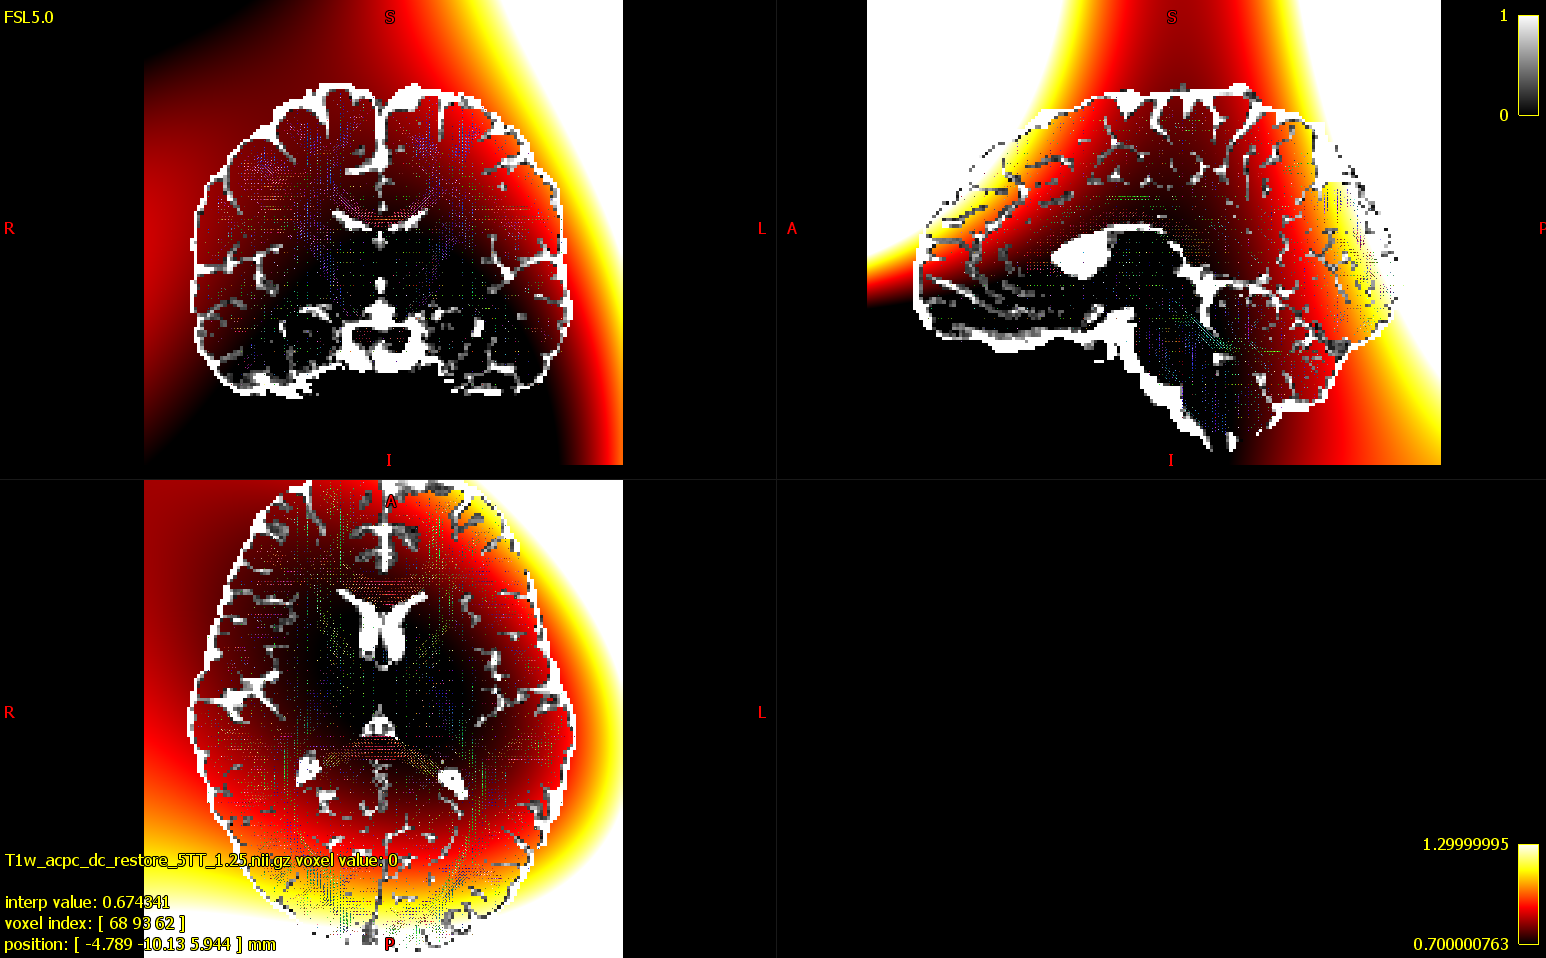
In that last step, I also generated the check_factors and check_norm files. You can see the estimated bias field in the image below (with color limits of 0.7-1.3), alongside an overlay of the CSF compartment, and WM ODFs.
I’m a little worried because I noticed that the scaling factors were outside the recommended range of [0.9,1.1]. Specifically, they were 1.03479, 0.857219, 1.12734.
In your experience, are these values are acceptable?
Many thanks for your help!
Roey
(for visualization purposes I’m also showing the values outside the brain, even though they were extrapolated beyond the brain mask I used when running mtnormalise).