Hello MRtrix experts!
I am looking at associations between potential liquid biomarkers and white matter integrity using FBA in one group. For my fixelcfestats design matrix I just have one column, made up of the biomarker values for each subject, with the contrast as “1” (looking at positive correlations). Because the absolute effect/ beta value is not directly interpretable, I was hoping to calculate correlation coefficients per fixel, to give a more easily interpretable visual representation of how highly these biomarkers correlate with FDC.
To achieve this I have applied the pearson correlation coefficient (r) formula:

to each fixel, with FDC as x and the biomarker value as y. I’ve used a combination of mrcalc and mrmath to do this.
I expected to see a similar pattern as for the effect size, just with the more easily interpretable r values. However, high/low effect sizes don’t seem to correspond to high/low r values. I’m guessing there is just something I don’t understand about the statistical modelling in fixelcfestats?
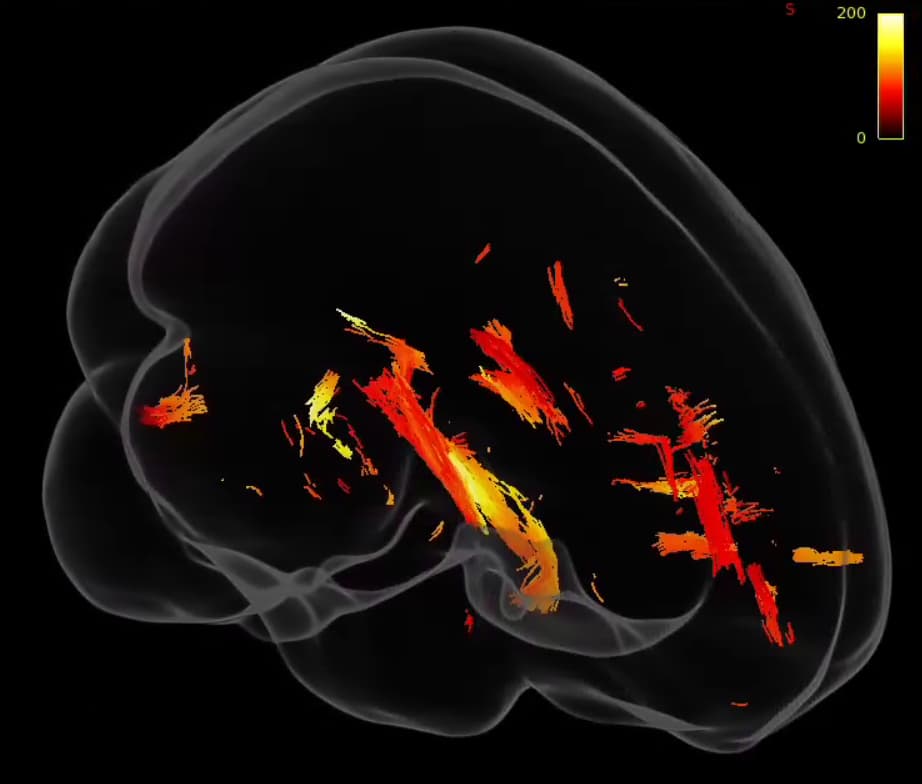
Here we have track segments corresponding to significant fixels coloured by absolute effect size:
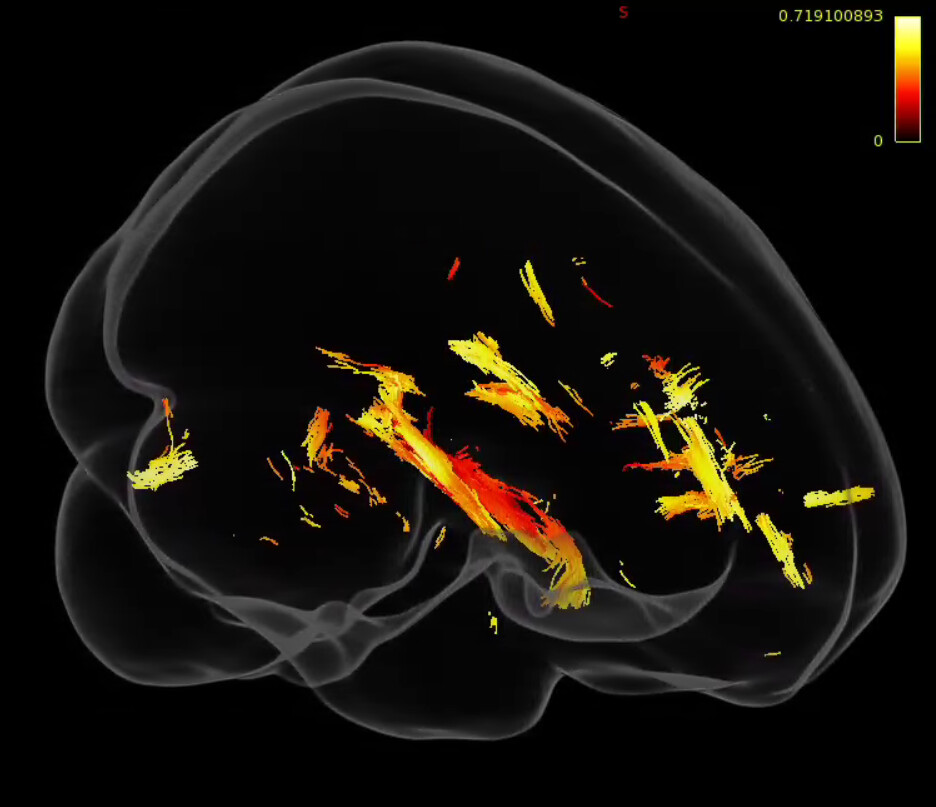
And here they are coloured by correlation coefficient:
My question is, are these correlation coefficient values appropriate to use for this analysis? Or are the values misleading due to additional considerations that need to be taken when working with fixel data? Is there some better method that can be employed to calculate correlation coefficients?
Thank you!