Hi, everyone
Recently. I’ve followed the Fibre density and cross-section - Multi-tissue CSD to analyze my dataset.
Now, I’ve gotten the results, but I don’t know how to explain them.
- After reading some forum posts, I now knew that I could extract significant tracts through
mrthreshold fwe_pvalue.mif -abs 0.95 sig_fixels.mif
but how can I exactly know which regions these significant results belong to (i.e are there any atlas that can help me locate them?)? And in which way should I display the sig_fixels.mif? Actually, I first want to locate them by registering the atlas to the wmfod_template.mif , as I ever mentioned here, but I only got a bna246_parcel.csv (bna246 is an atlas), and I don’t know how can I use this to perform statistical analysis of FD, FC, and FDC (i.e perform statistical analysis of FD, FC, and FDC based atlas.)? Below are my commands of the whole-brain tractography.
cd ../template
tckgen -angle 22.5 -maxlen 250 -minlen 10 -power 1.0 wmfod_template.mif -seed_image template_mask_eroded.mif -mask template_mask_eroded.mif -select 20m -cutoff 0.1 tracks_20m.tck

tcksift tracks_20m.tck wmfod_template.mif sift_2m.tck -term_number 2m

# perform fibre tractography on the FOD template, bna246 is an atlas.
tck2connectome -symmetric -zero_diagonal -scale_invnodevol sift_2m.tck bna246toTemplate_mni.mif bna246_parcel.csv -out_assignment assignments_parcel.csv
- When performing
fixelcfestats, I received a warning:
[WARNING] A total of 154763 fixels do not possess any streamlines-based connectivity; these will not be enhanced by CFE, and hence cannot be tested for statistical significance.
And after referring to this post, I try to limit the mask by the combination of tck2fixel and mrthreshold, but failed, here are the details of my attempts.
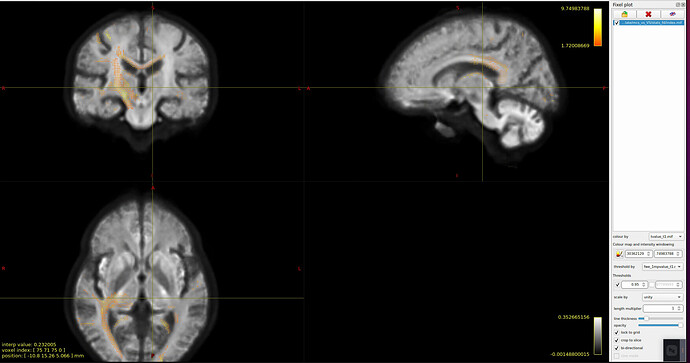
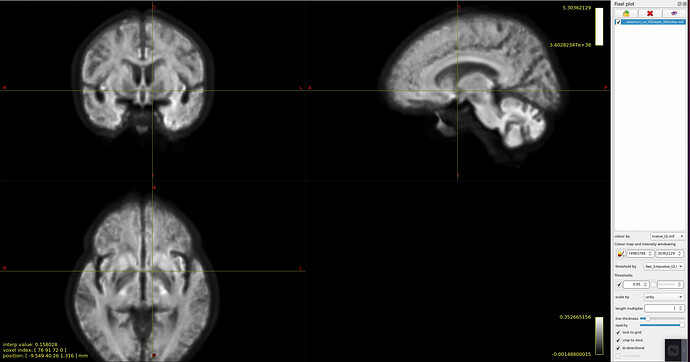
- I tried to view the results of stat_FD, and I found that after I threshold at 0.95, only those fixels t > 0 survived, and the significant fixels are different between the group1-group2 (t1) and the group2-group1 (negative t1, i.e t2). Is this normal? Picture 1: group1-group2, picture2: group2-group1. both were threshold at 0.95 and coloured by the corresponding t_value.mif.
Sorry for such a long forum post and thank you for reading. If there are any places I didn’t describe clearly, please let me know. Any help would be sincerely appreciated.
Wish you have a nice day,
Yuting

