Hi,
I’m currently working on a project where I hope to look at tractography at different angular thresholds to better understand the connectivity of the insula. I’m following these instructions to generate the connectome: ISMRM tutorial - Structural connectome for Human Connectome Project (HCP) — MRtrix 3.0 documentation
and I was wondering if there was any way to get quantitative data to explain my findings? Other than looking at the connectivity and pointing out the similarities and differences between the tractographies done at different angles, I’m not sure how else I can explain my results. I’d ideally like some numerical data.
Dear Tanya,
I don’t have numerical data for you, but I want to point out that the instructions you’re following (ISMRM tutorial - Structural connectome for Human Connectome Project (HCP) — MRtrix 3.0 documentation) are outdated. I don’t know of an official MRtrix page which is up-to-date, but you’re welcome to consult my scripts at GitHub - civier/HCP-dMRI-connectome: MRtrix scripts to generate dense weighted structural connectomes from the Human Connectome Project "minimally pre-processed" diffusion MRI data
Let me know if you have any questions.
All the best,
Oren
Hi Tanya,
What you’ve got there is an exceptionally open-ended question!
Firstly, I’m going to commence by taking your text literally, in that you are interested in one specific grey matter structure. If your interest were instead in a specific white matter bundle, then my answer would be quite different.
In a similar vein, the other thing to consider is the dimensionality of such “numerical data”. I.e. Are you specifically looking for attributes that are scalar in nature, so that you can plot the value of that attribute as a function of tracking angular threshold? Or are other “forms” of data useful, as long as they somehow satisfy the criterion of being “quantitative”?
One way of conceptualising this task is to think about construction of a whole-brain structural connectome, based on a parcellation within which the insula is one node.
(This would actually be interrogating the influence of tracking angular threshold on the subset of whole-brain connectivity that connects the insula as opposed to its influence on targeted tractography, which depending on the measures involved, may differ slightly; but it’s nevertheless an option to consider)
This would give you the ability to:
-
Extract the subset of streamlines that involve connections to the insula, and do “something” with those;
In this case, one thing you could do is generate a spatial map of streamlines density, and look at the differences in these maps for different angles. This is obviously a voxel-wise measure, but it’s still “quantitative” per se.
(If you want to do this using e.g. SIFT2 rather than raw streamline count there’s a couple of additional tricks I can provide for it to be done “correctly”)
If, of all of the connections between the insula and other parcels, there are specific connections that are of more interest than others, then this becomes a question about quantifying bundles of interest, which as I stated at the outset is its whole own thing.
-
Extract the row / column of the connectome matrix that corresponds to the insula, and do “something” with that.
E.g. You could quantify the similarity of those connectivity vectors for different angles, and look for peaks as a function of angle, suggesting that there is some form of “transition” where the “profile” of connectivity of the insula to the rest of the brain changes as a result of changing the tracking angle threshold.
There’s a huge scope of possibilities here, though many I’m foreseeing would require development of tailored commands, so I’ll try not to jump down the rabbit hole straight away.
What might help to make the question a bit more concrete would be if you could produce screenshots of results at two different tracking angle thresholds, and point out the “feature” that is different that you want to quantify in some way; that would help both yourself and others consider what solutions might be possible.
Cheeers
Rob
Hi Rob,
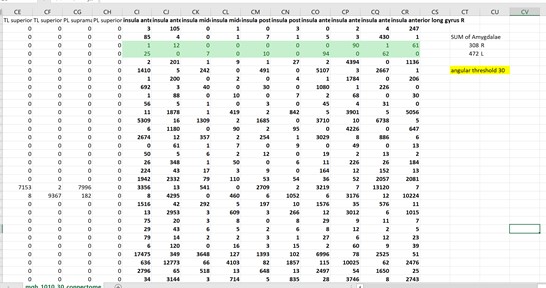
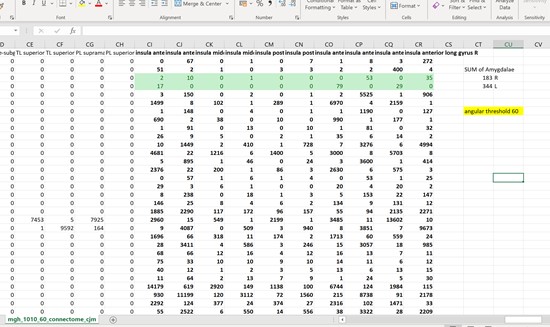
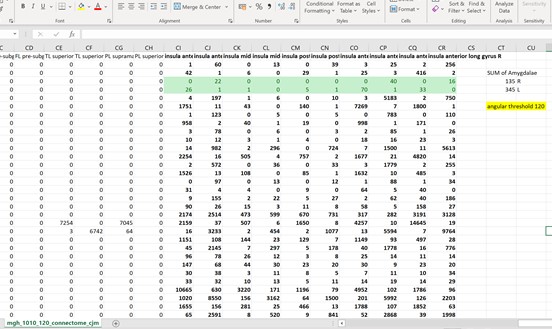
Thankyou so much for the ideas! What I ended up doing was looking at the connectome matrix and observing the number of streamlines connecting the insula to the amygdala. I did this with angular thresholds of 30, 60, and 120. What I found was that the number of streamlines actually decreased as I increased the angular thresholds. Is there an explanation for this? A conculsion I could draw from it? I was expecting the opposite to happen.
I’m attaching the connectome matrix screenshots which have the exact numbers.
Thanks,
Tanya
Hi Tanya,
What you’re reporting on here is the connection strength of one specific edge of the connectome, rather than the “profile” of connectivity of a specific node to the rest of the brain, which means that, as per my original framing, the scope of possibilities changes quite drastically.
Firstly, you need to think about all of the factors of the reconstruction that lead to the observation of a streamline count in that one specific edge. Are you generating the same number of whole-brain streamlines in each case? If so, you can instead interpret these values as “fraction of whole-brain streamlines that connect amygdala to insula”. Unlike performing a targeted tracking experiment between two pre-defined regions, where being “more liberal” with tractography thresholds might be reasonably expected to lead to more streamlines reconstructed, in this experiment more liberal tractography thresholds are applied everywhere else as well. So if more liberal thresholds make other brain areas “easier to track” but don’t make a huge difference in your pathway of interest, this could lead to a decrease in streamline count in the latter.
I would also note that a 120-degree angular threshold is permitting streamlines to “turn around” in a single step. This is totally ambiguous since you could follow the same fibre orientation in the opposite direction by performing only a 60-degree curve.
An alternative way of thinking about the experiment might be something like: of those streamlines assigned to the insula, what fraction of those are assigned to the amygdala? The advantage of that framing is that you can extract the relevant streamlines trajectories and see how the streamlines emanating from that structure change in distribution depending on tracking angular threshold. E.g. It might be that by becoming too liberal, streamlines that should be travelling directly to the insula are instead erroneously latching on to some other fibre orientation and projecting elsewhere.
Rob