Hi Rob,
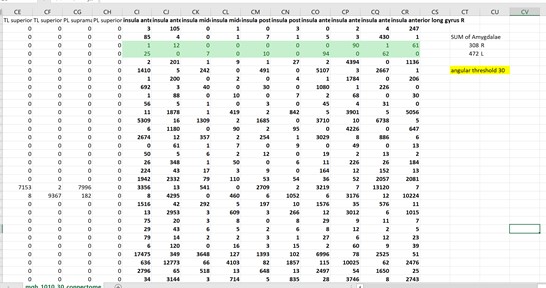
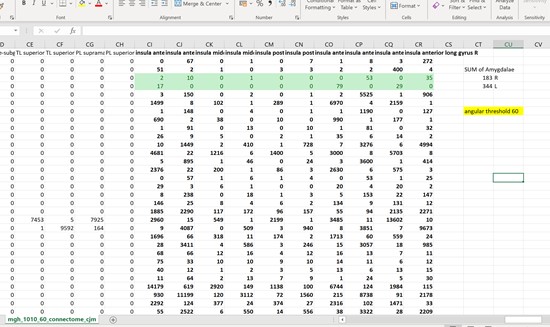
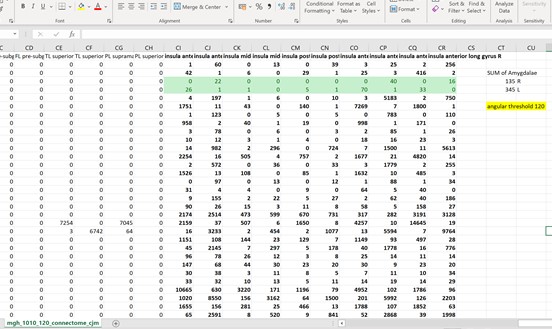
Thankyou so much for the ideas! What I ended up doing was looking at the connectome matrix and observing the number of streamlines connecting the insula to the amygdala. I did this with angular thresholds of 30, 60, and 120. What I found was that the number of streamlines actually decreased as I increased the angular thresholds. Is there an explanation for this? A conculsion I could draw from it? I was expecting the opposite to happen.
I’m attaching the connectome matrix screenshots which have the exact numbers.
Thanks,
Tanya