Dear MRtrix Developers Team,
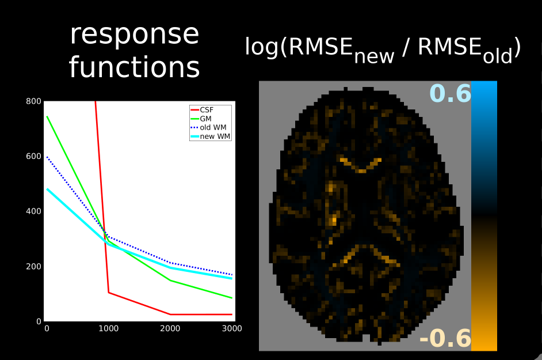
I hope this message finds you well. I am reaching out to inquire about the possibility of reproducing a plot similar to those presented in the Dhollandar paper @ThijsDhollander (reference included below).

I have already calculated all the response functions for my dataset, which includes 2 b0, b750, b1500, and b3000 images. Specifically, I would like to reproduce a plot for a sample that includes ST, MSMT, and SS3T, similar to the example provided in the paper.
Reference:
https://cds.ismrm.org/protected/19MProceedings/PDFfiles/0555.html
Could you please provide any advice or detailed steps on how to achieve this? Your assistance would be greatly appreciated.
Thank you for your time!
Kind Regards,
Ibrahim