Hi,
I’m encountering a higher value for the cerebellar region than the others in the SIFT2-weighted connectome I’ve generated.
The data is a multi-shell dataset, preprocessed with QSIprep, b2000 extracted, done the routine 5ttgen hsvs and tractography (ACT, dynamic seeding, cut-off 0.06, 50M), and SIFT2. The atlas I’m using is the 4S456, for 400 cortical Schaefer’s and 56 subcortical volumes transformed into the T1w space: AtlasPack/subcortical_merged/tpl-MNI152NLin2009cAsym_atlas-SubcorticalMerged_res-01_dseg.tsv at main · PennLINC/AtlasPack · GitHub
After tcksift2 I multiplied the connectomes by “mu”. However, I noticed disproportionately high weights for the cerebellum. For example in one of the cases, the mean (sd) for the weights [upper triangle] of the non-cerebellum brain is 0.02 (0.13), while the mean (sd) for the cerebellum is 2.58 (2.21) with a maximum connection weight of 11.17. It is the same for all other subjects.
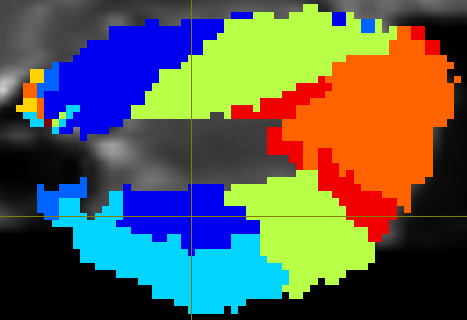
Investigating further, I noticed the majority of the ROIs are "sandwich"ing the cerebellum (figure below). The maximum weight in all subjects is the connection between the dark blue and green ROI seen below belonging to one of the hemispheres.

My questions are:
- What can be the possible explanation?
- Can we consider cerebellar values a bit of an outlier, and if so, is it okay if I remove the cerebellum rows/columns in the connectome that’s being generated with tck2connectome before proceeding with graph theory analysis (e.g., modularity)?
- Should I change anything in doing tcksift2 as well?
Thanks in advance!
Best,
Amir