Hi MRtrix community,
I’am a beginner in this world of advanced diffusion post-processing.
I’ve a problem using SIFT2 text file to display tractograms.
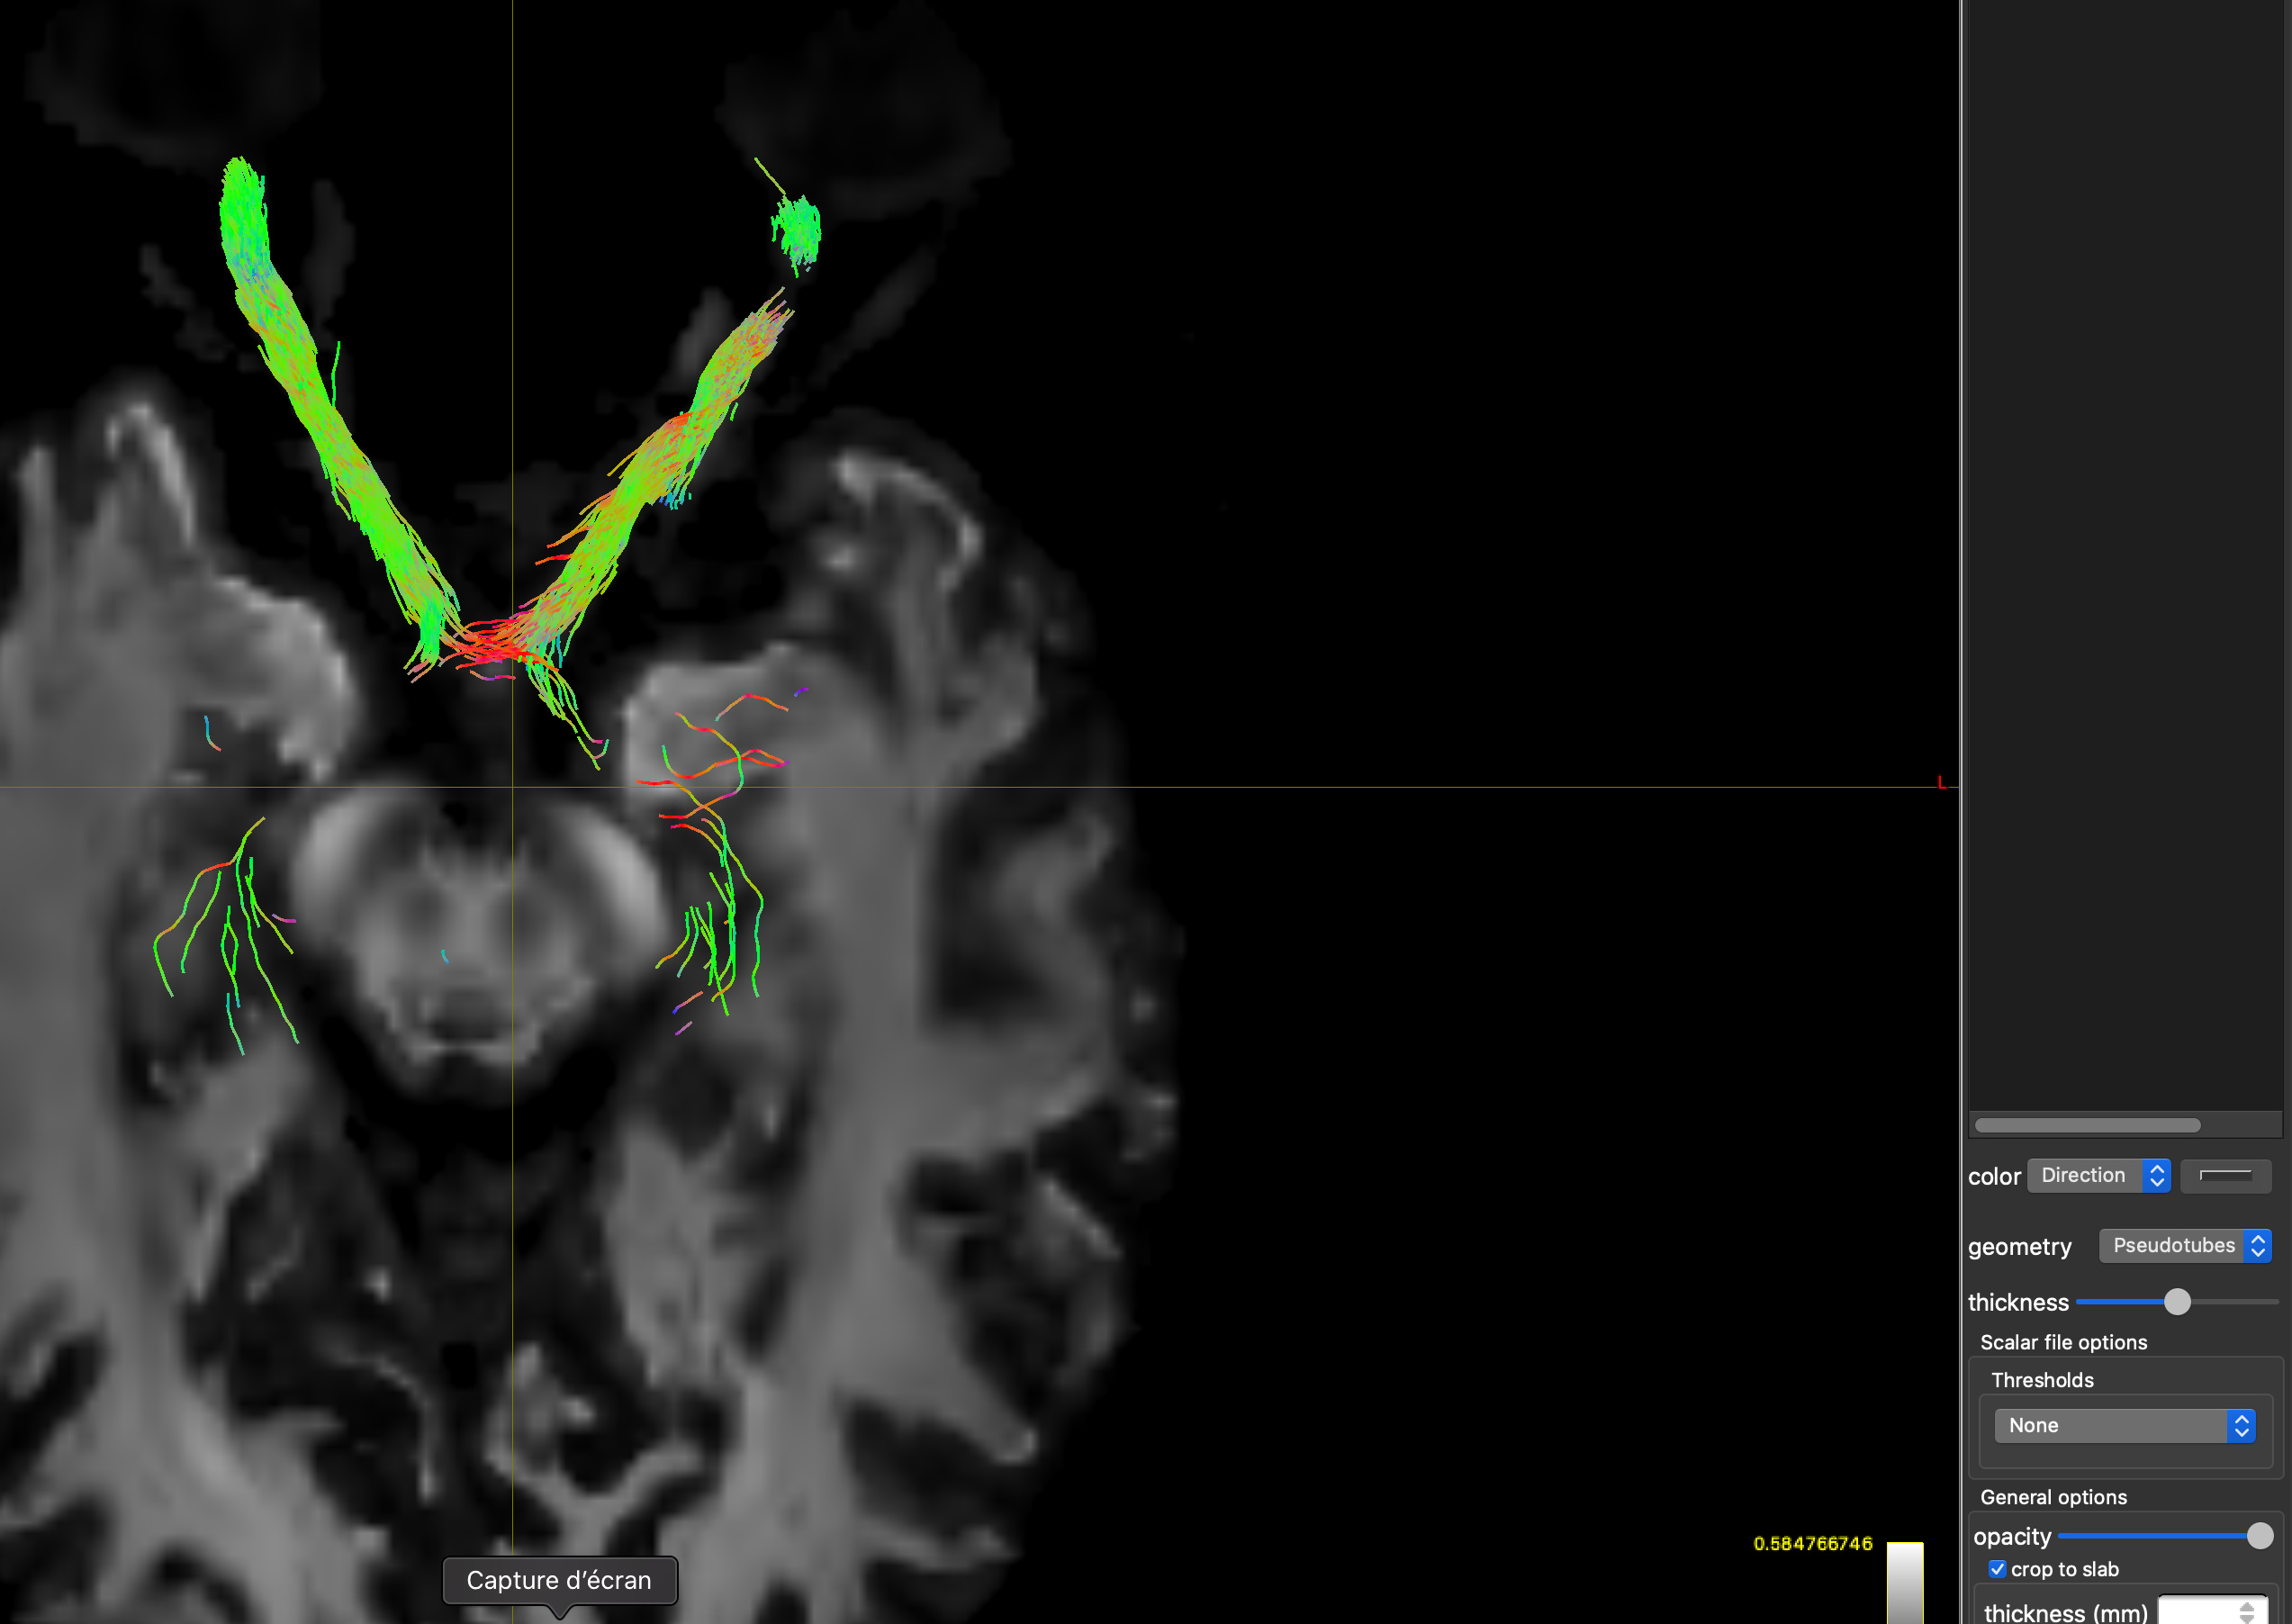
I can load without issue the .tck file :
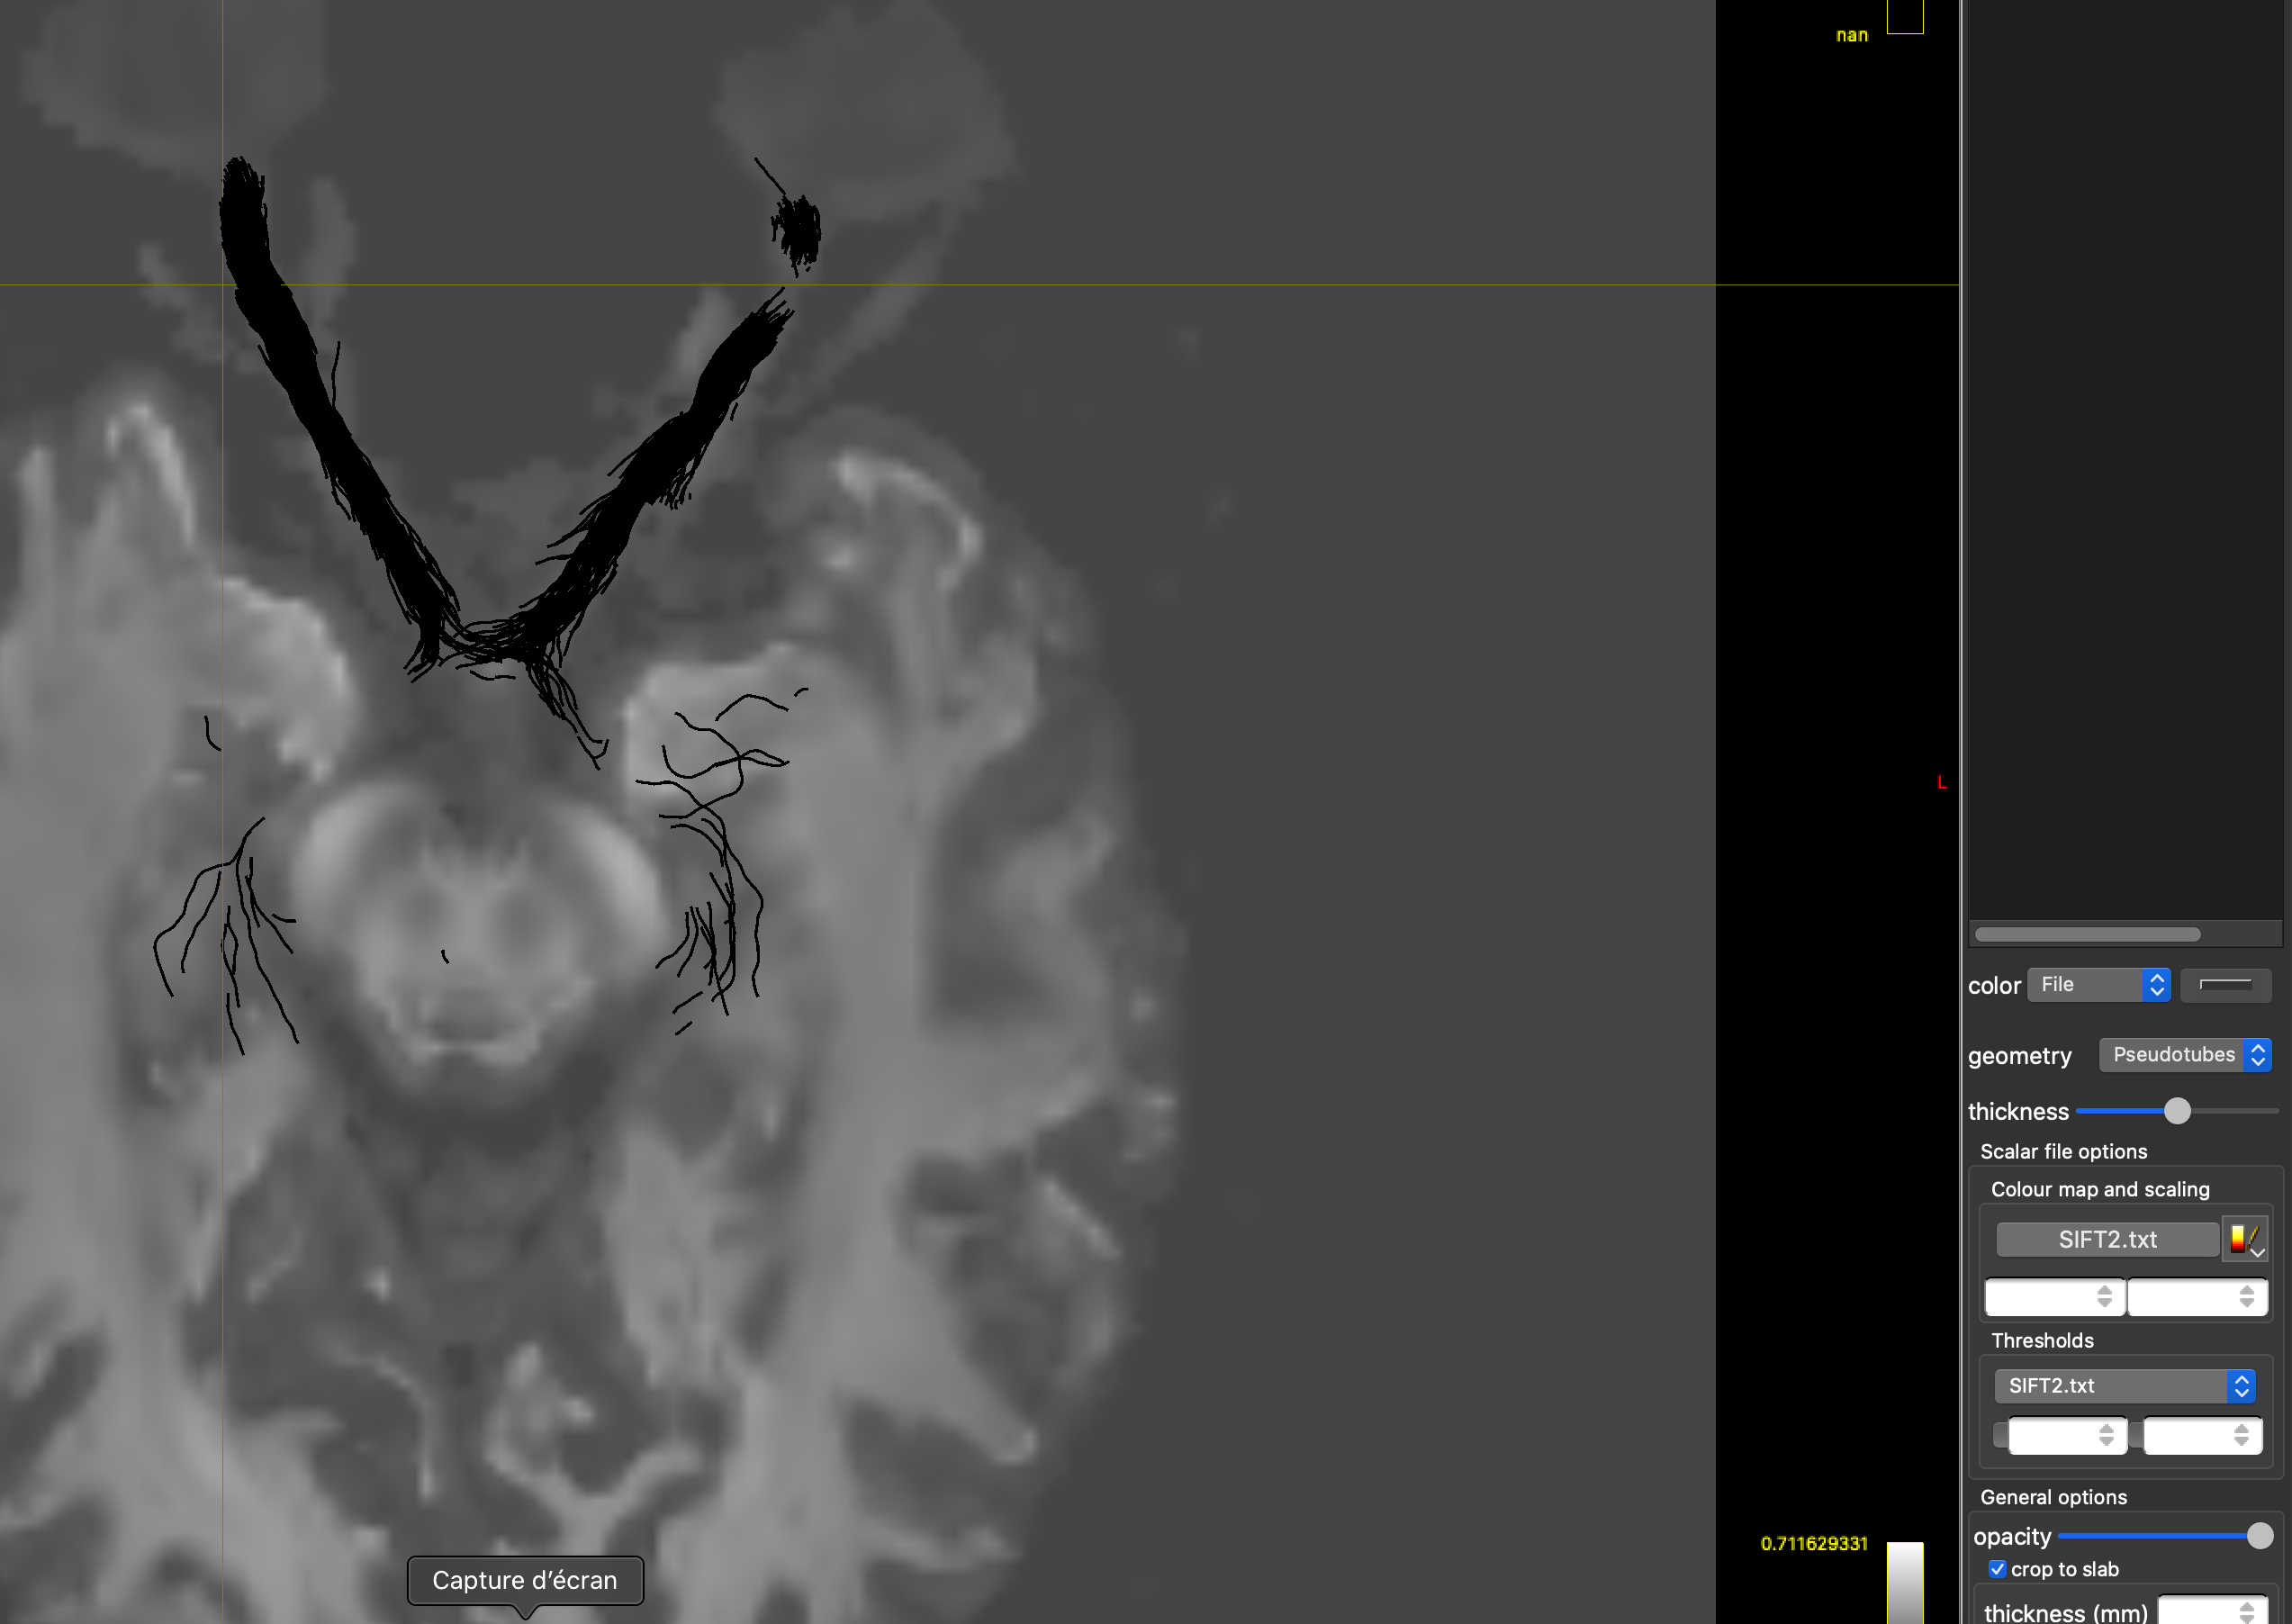
But when I choose file in color menu, all tracks appears black and I cannot manage to modify parameters of the threshold section :
Could you help me with that ?
Best regards,
I think you just need to set the colourmap levels using the entries provided. They’re blank, which probably means they’re defaulting to zero.
If that’s not the issue, I’ll need to look into it, but it might be a while before I find the time…
Thank you Dr TOURIER for your reactivity
Unfortunately I cannot interact with those blank fields.
Nothing happens when I enter values or click on increase/decrease arrows.
Thank you for your help,
nb : I run with the latest release of MRtrix
The normal behaviour is for those numerical text boxes to be populated with the maximum & minimum values in the input file. If it’s not automatically populated, it’s because there was some sort of issue in determining the maximum & minimum values, But historically whenever this has cropped up it’s still possible to manually put values in there (just make sure you hit the ENTER key after typing in a value). If you can’t even do that, it suggests there’s something more going on.
The first thing to do would be to check the actual contents of the text file; e.g. “head -c400 SIFT2.txt”. For instance one way this may theoretically arise is if the input file contains entirely non-finite values.
Hello and thank you for your help
here is what is displayed with the command line you gave me :
# command_history: tcksift2 Tracto_All.tck WM.mif SIFT2.txt  (version=3Tissue_v5.2.8)
0.005459696168 0.004276051178 0.009996946541 0.004227468616 0.004208763221 0.004390549131 0.01267040481 0.004610828142 0.005028313939 0.00563109619 0.005527981326 0.01939239254 0.0169630802 0.005871162673 0.006431883248 0.005214943407 0.004355633783 0.02731823933 0.005405125041 0.004399228984 0.004697609892 0.004%
I managed to change colors of tracts by clicking and moving up/down in first fields just under the first SIFT.txt.
Unfortunately no values appeared in those fields and I can’t interact with thresholds fields.
Thank you so much for your help.
Have a nice day
Hello
It’s exactly what happens actually : there’s some values in white with white background.
But for the thresholds fields I didn’t manage to find values and when I drag up ad down nothings seems to happen.
thank you for your help,
Ok, first off, I reckon you can get around the white text in white background issue by disabling dark mode. It’s a temporary fix, eventually we’ll need to figure out why those fields don’t honour the system colour scheme and fix that in the code.
Otherwise, they’re a good chance the issue is the presence of a few exceptionally large values in the SIFT.txt file, causing the min/max automatic ranging to cover unrealistic values, and making it difficult to manipulate back to a reasonable range because everything is then relative to these enormous values. See if you can identify any such large values in the text file (using MATLAB or python, or whatever you have at your disposal). Otherwise, have a quick look at the file contents, see what values it typically contains, then set the min/max values for the colourmap to something sensible for those values by typing the values directly in the text boxes (don’t bother trying with the mouse when the range is so far from what it needs to be…).
Hopefully that’ll get you closer to sorting this out…
The white text on white background should have been fixed in https://github.com/MRtrix3/mrtrix3/issues/1865. The border colour and background colour of the text field match those before this change (see here) so I suspect that your MRView is not 3.0.0 but from an older installation.
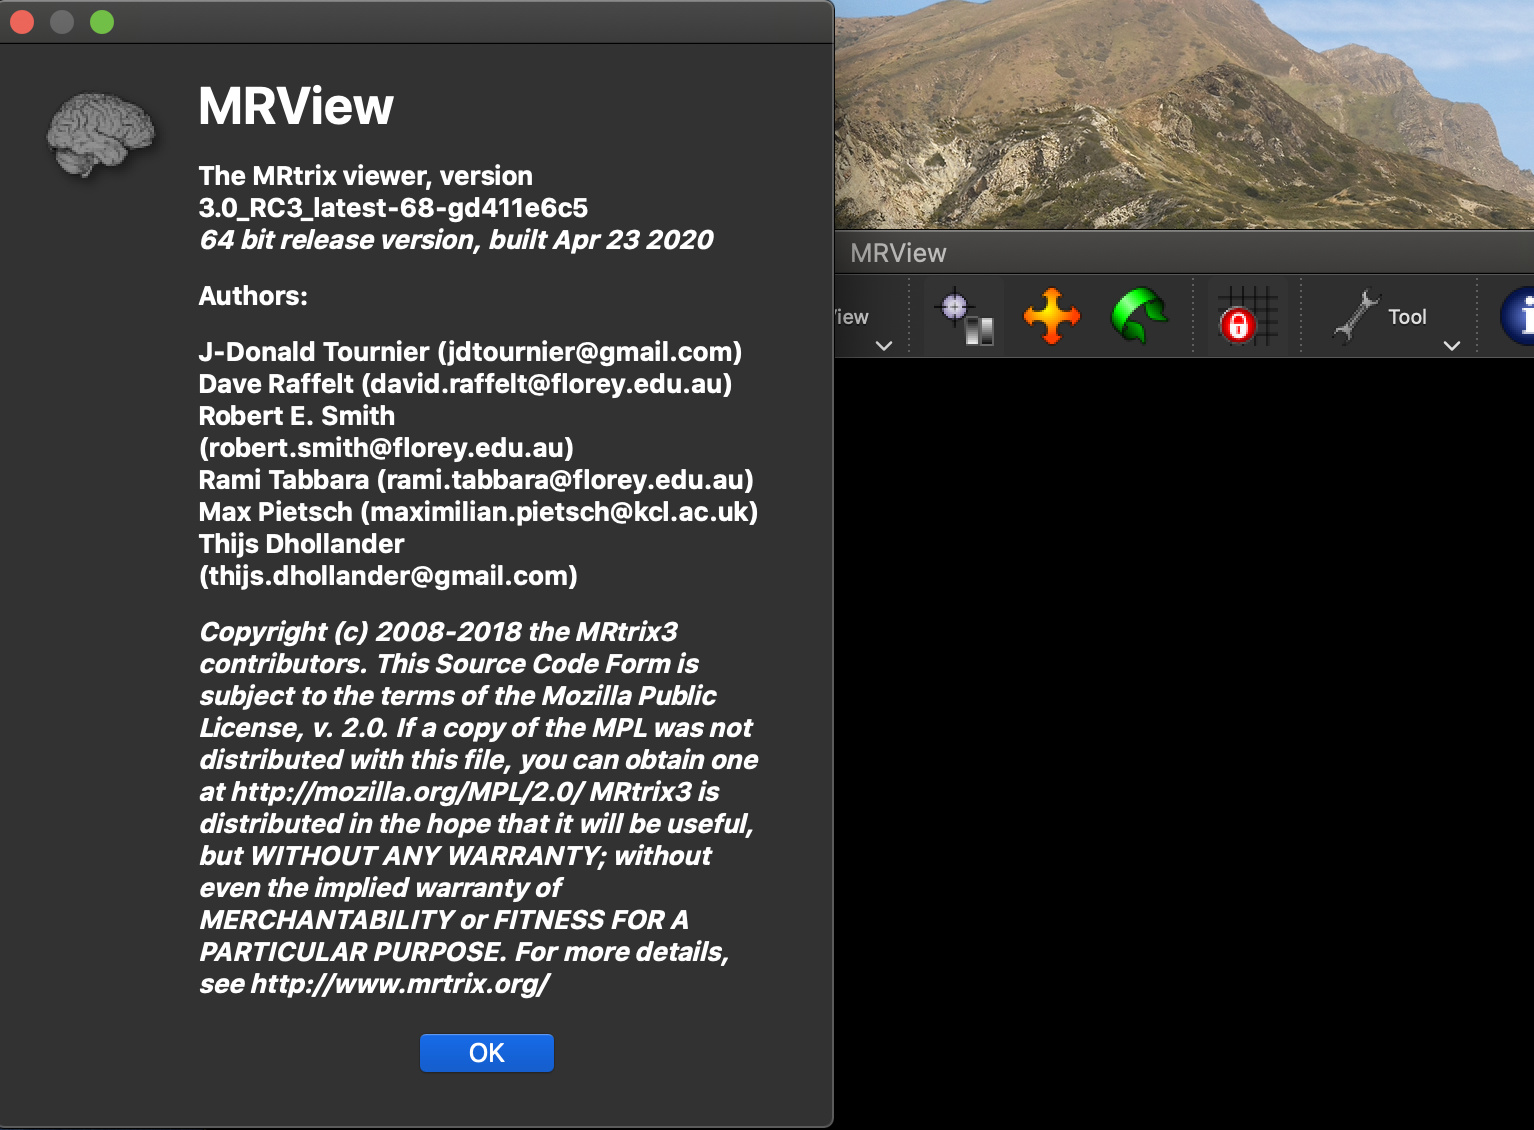
@clemjean Can you please confirm the version of mrview ((i) --> About MRView)? If the MRView version is 3.0.0, in which way did you install it and what version of Qt is it using ((i) --> About Qt)?
@maxpietsch : for sure
And QT version is 5.14.1
I installed previous version of Mrtrix using homebrew as explained in the documentation, and then update to the version 3. I did not tried to display tracts using the previous version, so I can’t tell if this issue is linked to the update or not.
You are not using the latest version (3.0.0), your version is from Dec 17 2019 (d411e6c5), the mentioned fix is from Jan 5 2020 (5bea4a2).
Something went wrong during the update or you have not changed the PATH to (first) point to the latest version. Did you update via homebrew (brew upgrade mrtrix3), via the precompiled packages or from source?