Hi,all
Thanks to @rsmith , @jdtournier and @maxpietsch 's patient answers and everyone’s past posts, I finally ran through the multi-tissue FBM code.However, I still have a few questions and need to ask all MRtrixers for help.
-
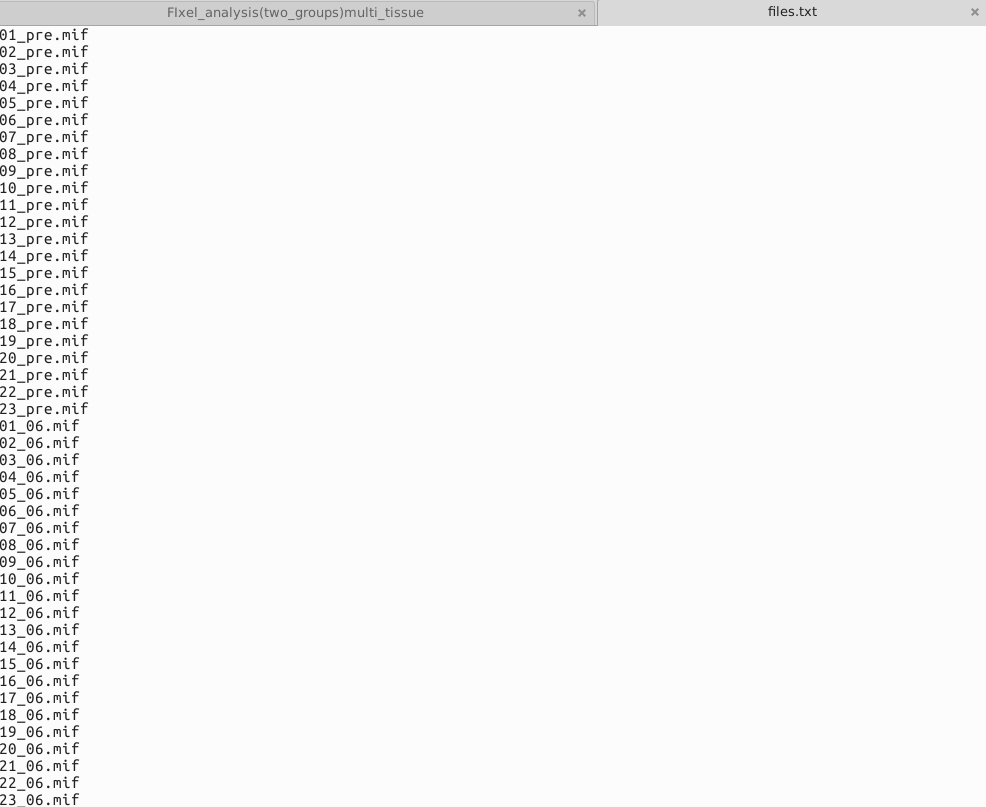
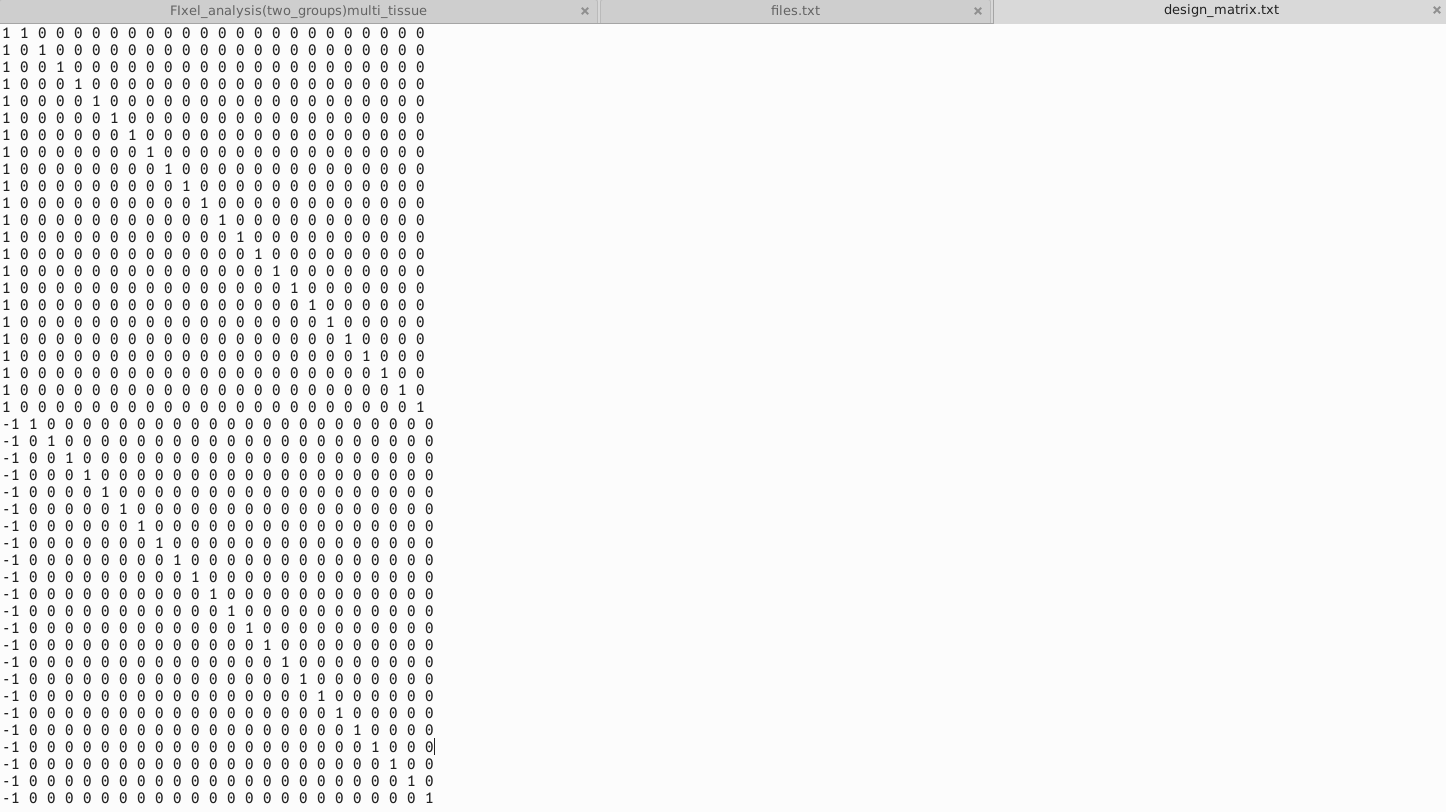
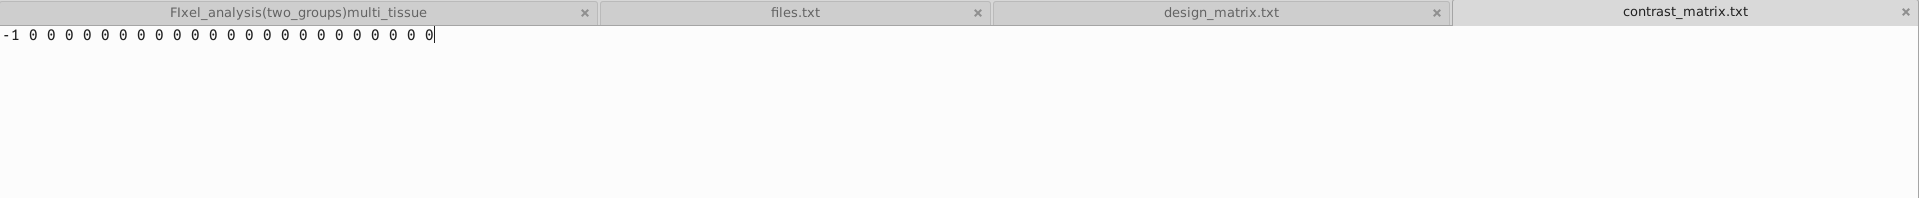
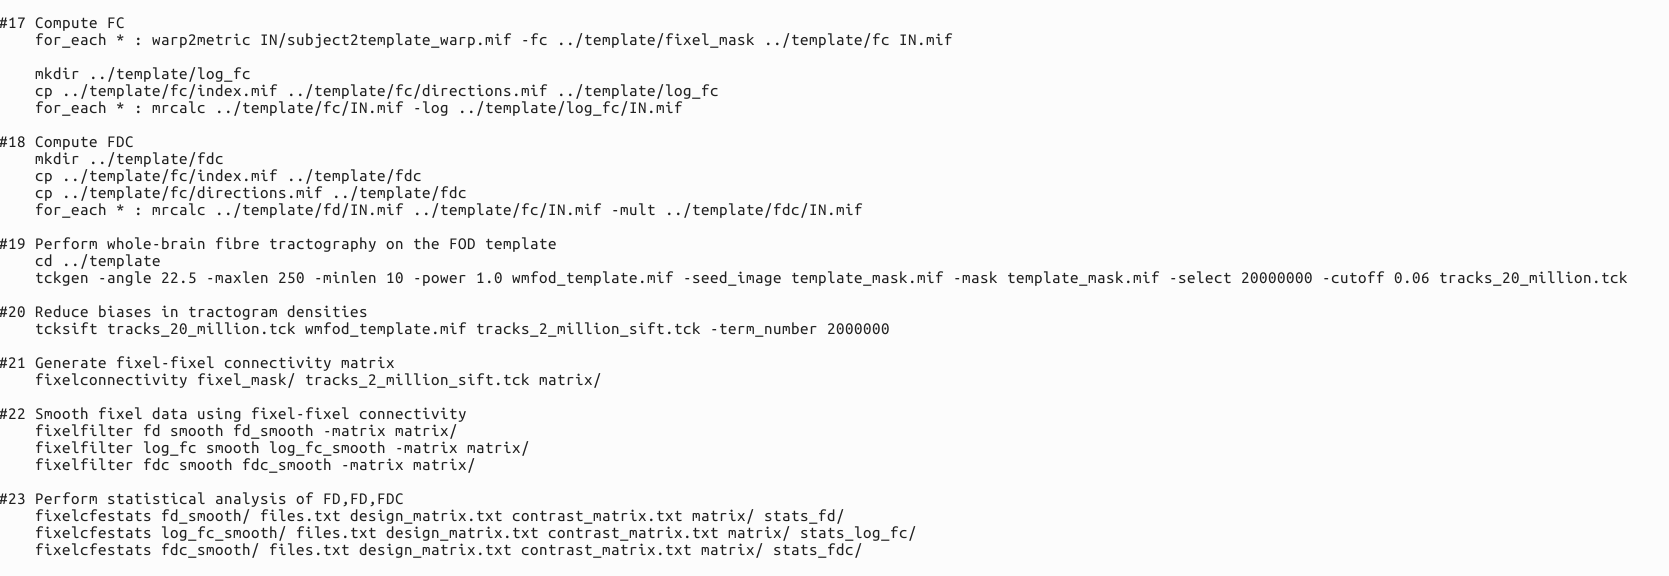
I compared the data of 23 patients before and 6 months after treatment, and I wanted to investigate whether the treatment had a significant impact on the patients’ Fixels’ FD, FC and FDC. Use paired T-test.These are files.txt ,design_matrix.txt ,contrast_matrix.txt that ueed in Step 23.Design_matrix and contrast_matrix are set according to this link.
-
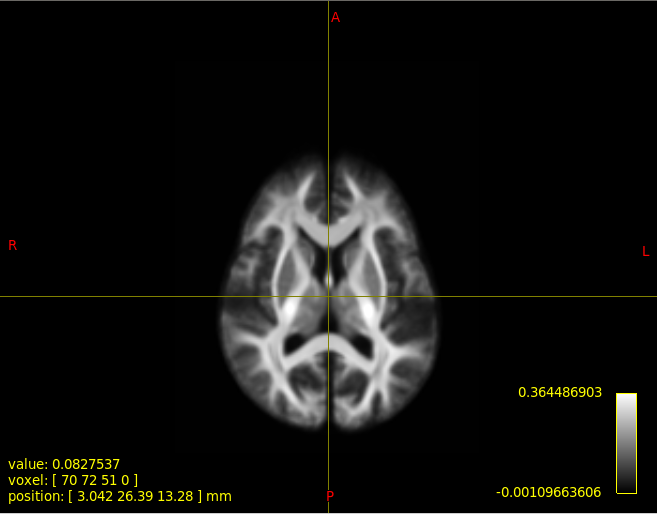
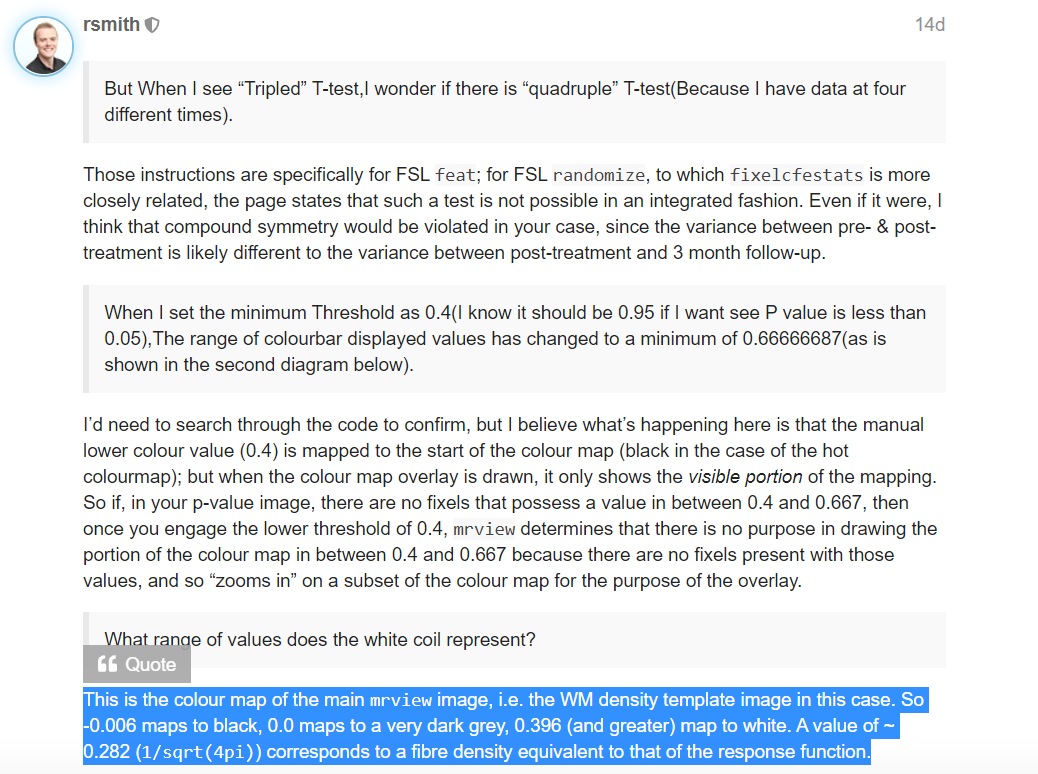
This is the step where I show the statistics.At first,I show wmfod_template.mif using mrview(image 1).P.S. The value in the lower right corner of the colourbar in image 1 represents the WM density(image 2), right?
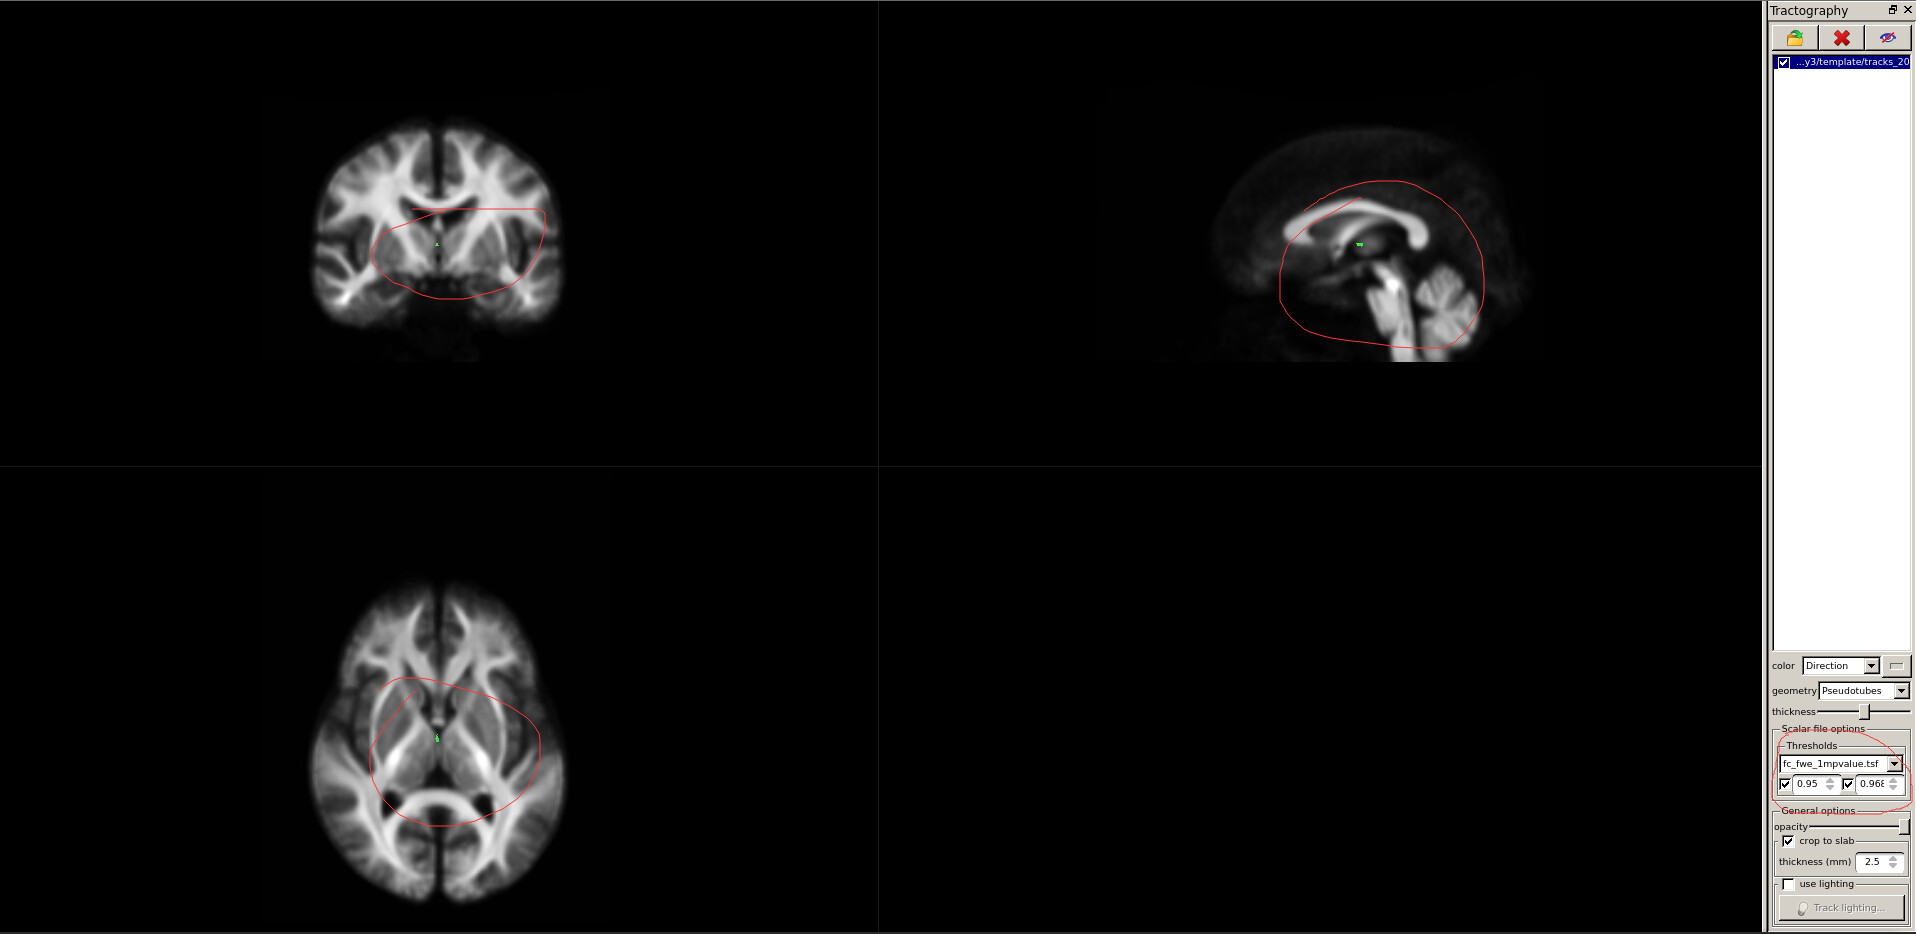
Then,What I’ve shown here is the streamlines with significant FC differences(image 3).(I load tracks_200k_sift.tck according to this).The P value(actually is (1-p) value) range of FC after FWE correction is 0 to 0.968,so the lowest value I displayed is 0.95 (corresponding P value is less than 0.05).As a result, there were only a few streamlines with significant differences.Obviously, this analysis result cannot be used for the writing of the paper.What’s more,in the FD comparison of the two sets of data, the FWE-corrected P values (actually (1-P) values) ranged from 0 to 0.289;in the FDC comparison of the two sets of data, the FWE-corrected P values (actually (1-P) values) ranged from 0 to 0.375.In other words, there is no significant difference between the FD/FDC indexes of the two groups of data at different time points by paired T test.In general, the results of the analysis are not what we want to see.What we would like to see is a significant difference in streamlines.
-
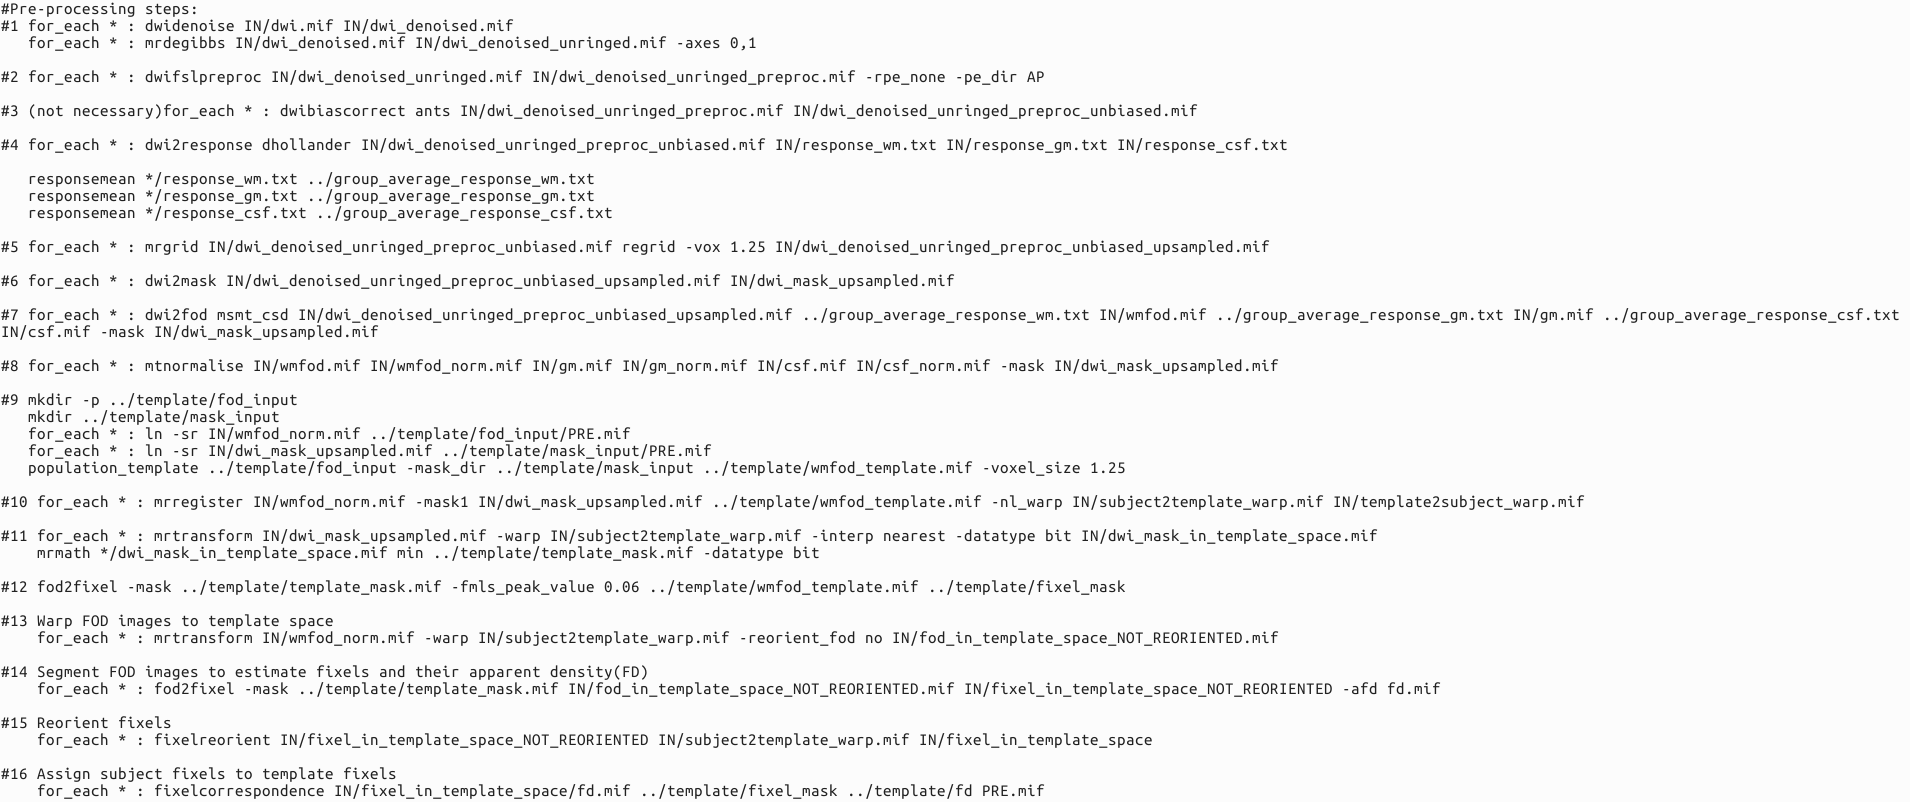
Here is my code.I don’t think the final result I got that didn’t match my expectations was because the code was wrong.Because I’m not going to be able to run the whole process if the code is wrong.
4、If you think that my code is error-free, is it possible that the reason I’m not getting the results I want is that after treatment these three indices don’t change significantly at all or there are very few that are significantly different?
Thanks,
Silver
