Hello everyone,
I’m new to DTI analysis. I am interested in assessing tracks between two ROIs that are functionally defined.
So far, I managed to create tracks that look reasonable with:
tckgen -algorithm iFoD2 \
 -select 2000 \
 -seed_image ../../masks/${subj}/${subj}_rPPA.mif \
 -include ../../masks/${subj}/${subj}_rRSC.mif \
 -maxlength 100 \
 -minlength 5 \
 -cutoff 0.1 \
 -angle 25 \
 -stop \
 -seed_unidirectional \
 wmfod_norm.mif \
 rPPA_to_rRSC_uni_2000tracks.tck
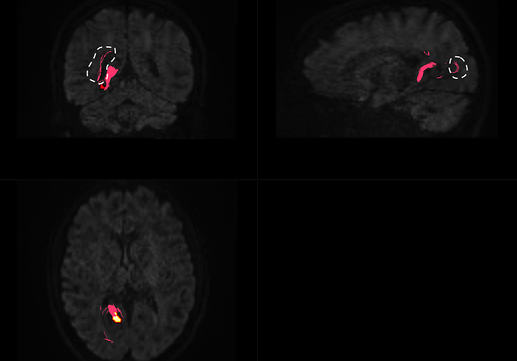
But, some of the tracks look spurious (at least, to me!). In the screenshot below, there are some streamlines that look like taking some detours - I marked them with white lines.
I am curious about what is a recommended practice in cases like this. First, I am not entirely sure whether what I see is a false positive (I mean, it looks funky). Would people try different parameters to see if they can create tracks that are more reasonably looking? If yes, what are the parameters that I should play with first? I read some about the step size and angle, but I am still struggling to fully understand how changes in those parameters will impact the streamlines. I admit that the max length and the number of streamlines were very arbitrarily determined by me (I didn’t know where to start!).
Another question I have is — I use tck2connectome to get the outcome of these tracks, but I don’t fully understand all the scale options. For example, if I were to get the mean FA using the tcksample, should I not use any scale options? And, if I want to control the distance between the ROIs (when I have multiple pairs to compare), should I do the -scale_length? I know the description in the tck2connectome includes information about this, but as a newbie, I still struggle to fully understand these. I would appreciate any help!
Thanks so much.
