Hi Community,
I am getting incomprehensible results for dwi2response (msmt_5tt).
With the increase of b-values, the shape of the disc should be smaller and smaller, as shown in the figure below
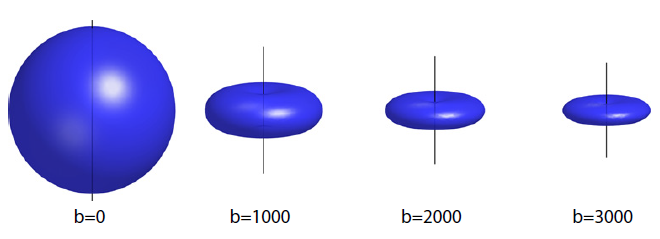
But, I am getting strange results, as shown in the figure below(b-values from left to right in the order:0, 1000, 2000, 3000)
Any suggestions there?
Cheers,
Jian
Again, this is probably due to a limitation in shview, which will be fixed in our new release (discussion here, if you’re interested). What’s happening is that the scaling of the response is normalised to the first SH coefficient, which is the mean amplitude for that shell. So the profiles you’re seeing are scaled differently here. You can disable the normalisation in the menu, but you’ll then have to scale the display back down quite a lot to see the actual surfaces again (using the mouse scroll function) - they’ll normally show up far too large to actually show at all.
This will all work much more sensibly in our forthcoming release…
That makes sense. Expecting forthcoming release.
Thank you for your answers.
Cheers,
Jian

