Hi all,
I’m running a longitudinal fixel-based analysis on a large exercise intervention trial and I’m seeing a systematic increase in mean fiber density (FD) of approximately 0.1 at the post-intervention timepoint relative to baseline. This offset is present across virtually all 72 TractSeg-defined white matter tracts and across all subjects regardless of intervention group, which makes me think it’s a preprocessing artifact rather than a biological effect. I’ve been trying to track down the source and would appreciate any guidance.
Some information:
- Post-test FD range across tracts: 0.4223 to 0.6335
- Range of difference: -0.0689 0.2984
- SD/Mean ratio: 1.162
Study design:
-
Two-timepoint longitudinal study (baseline and 12-month post-intervention)
-
~636 participants at baseline, ~480 with post-test diffusion data (attrition)
-
3 acquisition sites
-
Multi-shell diffusion data, already eddy/distortion corrected before entering the MRtrix pipeline
Pipeline (both timepoints):
-
mrconvert→dwidenoise→mrdegibbs→dwibiascorrect ants -
mrgrid regridto 1mm isotropic -
dwi2response dhollander(per subject) -
responsemeanto compute group-average RF -
SynthStrip for brain masking
-
dwi2fod msmt_csdusing the group-average RF -
mtnormalise -
population_template(separate template for post-test data) -
mrregister→mrtransform→fod2fixel→fixelreorient→fixelcorrespondence→warp2metric -
fixelfilter smooth -
Mean FD/FC/FDC extracted per TractSeg tract using
mrstats
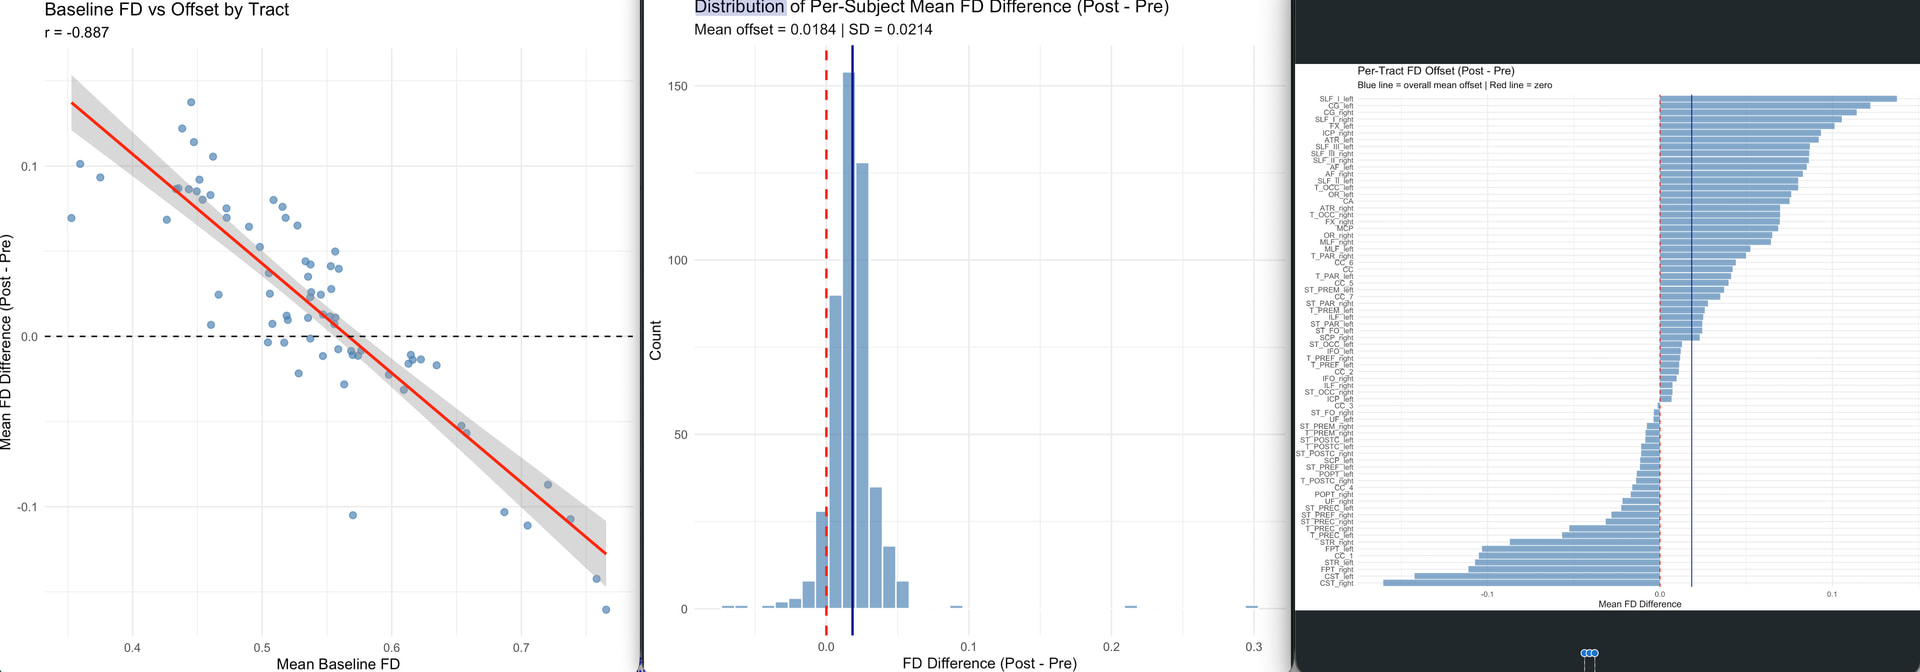
The problem: Post-intervention mean FD values are systematically ~0.1 higher than baseline across all subjects and tracts. The offset is not uniform, when I plot baseline tract-level mean FD against the offset (post minus pre), I get a strong negative correlation (r = −0.886, p < 2e-16). Tracts with lower baseline FD show larger increases, and tracts with higher baseline FD show smaller increases.
What I’ve investigated:
-
Different group-average response functions: Because of attrition, the baseline and post-test group-average RFs were computed from different subject pools (636 vs 480 subjects). I tried re-running
dwi2fodand all downstream steps for the post-test data using the baseline group-average RF, but this did not substantially reduce the offset. -
Separate population templates: Baseline and post-test data were registered to separate population templates (one built from baseline FODs, one from post-test FODs). I’m wondering whether different templates could produce systematically different FD values even when the same RF is used?
-
mtnormalise: Both timepoints hadmtnormaliseapplied independently. Could differences in the normalization (due to different subject pools or different template masks) produce this kind of multiplicative scaling effect?
My questions:
-
Given that using the same RF didn’t fix the issue, what else in the pipeline could produce a multiplicative offset (strong negative correlation between baseline FD and the shift)?
-
For longitudinal FBA, is it necessary to use a single population template built from both timepoints together, rather than separate templates? Could template differences explain this pattern?
-
Is there a recommended approach for
mtnormalisein longitudinal designs? should both timepoints be normalized together, or is independent normalization acceptable? -
Are there any other common pitfalls in longitudinal FBA that could produce this kind of systematic offset?
Any advice would be greatly appreciated. Happy to share more details about the pipeline or diagnostic outputs.
Thanks!