Hello,
I would like to visualize all seed points used for the creation of my tractogram. I therefor used the -output_seeds seeds.txt option of tckgen. How do I convert the resulting .txt output file in a .tck file to be able to visualize it with mrview? I tried using tckconvert, however, always receive the error segmentation fault (core dumped)
I tried following the instructions in Visualise successful seed points in tckgen - #2 by mblesac however struggle understanding the code that was linked.
Thank you in advance for your help,
Franziska
1 Like
Hi @FEHildesheim,
I had a quick look into this, and as far as I can tell, the issue is with the trailing commas left behind in your seeds.txt file (judging from the command you sent me privately). Try this command instead:
awk -F, '!/^#/ { print $3,$4,$5; }' < tckgen_seeds.txt > seed_coords.txt
Then the tckconvert call should work:
tckconvert seed_coords.txt seeds.tck
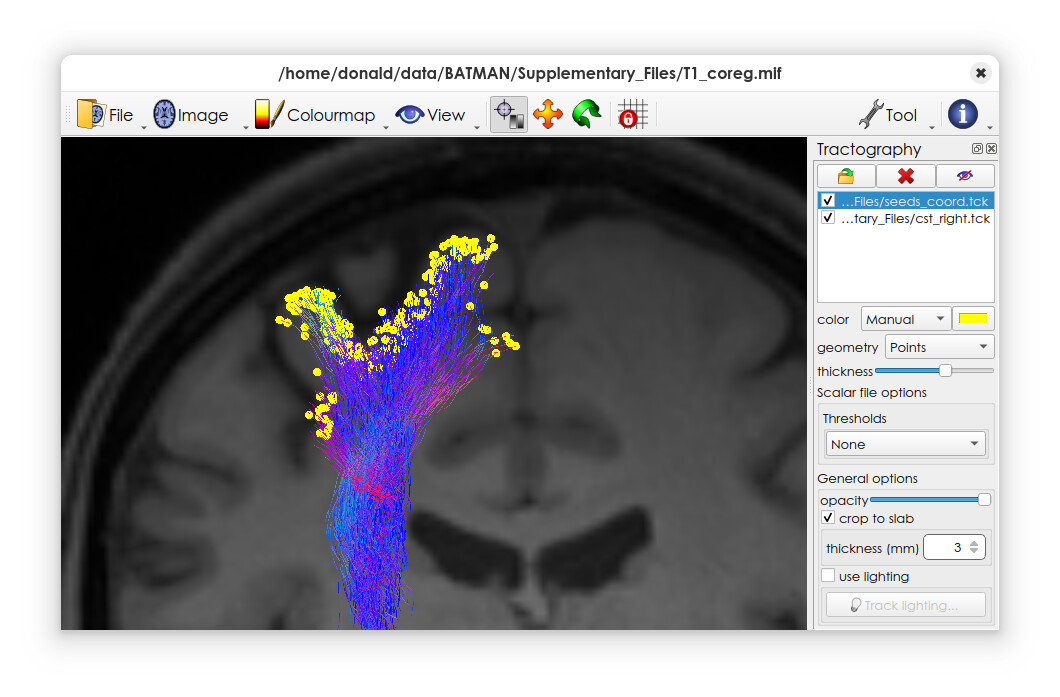
You should then be able to load this file into mrview, and set the geometry to ‘points’ – along with the original tractogram if desired.
Here’s an example on my system
Cheers,
Donald.
3 Likes
Hi Donald,
Thank you for your quick response!
I used the command you suggested and reran tckconvert, but unfortunately, I’m still receiving the same Segmentation fault error. I preset 5 million fibers during tckgen, so my .txt file has 5 million lines. Could this be causing the error?
The idea behind visualizing all 5 million seed points of the traced fibers is that I would like to see how the seed density is affected when synthetically lesioning the brain to mimic a stroke lesion. If the stroke lesion damages, for example, 10% of the white matter (I used dynamic seeding within the white matter), the preset 5 million fibers will be “squeezed” into the remaining 90% of the white matter, which would cause both the seed density and streamline density to increase. Does this mean that in the lesioned brain, certain intact fiber tracts may be overrepresented compared to a healthy brain, simply because more seeds/fibers are available for a smaller area?
Thank you for your help,
Franziska
Hi @FEHildesheim,
That sounds like an interesting idea, worth looking into!
Regarding your segmentation fault, any chance you could send me the file in question? I can try to reproduce the issue on my side and see if there is a simple fix…
All the best,
Donald.
1 Like
OK, issue reproduced on my end, and there was indeed an issue with our code. The proposed fix is now under review.
This crash is due to the way we buffer the output before writing to file (which was done to avoid issues with file fragmentation). By default, the buffer size is 16MB, which is ample for any reasonable streamline. But clearly in some case, this is too small – and the code wasn’t designed to deal with that…
The change proposed above should fix that for all use cases, but in the meantime, the simplest solution for you to get on with your own work is to override the default buffer size (thankfully, we provide a config file option for that):
tckconvert seeds_coord.txt seeds_coord.tck -config TrackWriterBufferSize 60000000
This sets up a ~60MB write-back buffer, which should be just enough in your case. You may need to use large sizes if you anticipate processing larger files…
All the best,
Donald
1 Like
Hi Donald,
Thank you for this solution. The seeds_coord.tck file was successfully created.
When looking at the output file, I am wondering why seed points appear color-coded? I thought each seed point is a single point in the coordinate system without any information on directionality, simply representing the starting point of each tracked fiber?
Thank you,
Franziska
This is because you’ve essentially created a single massive streamline consisting of all the seed points one after the other – so the viewer will by default colour-code them according to the tangent, which in this case is indeed fairly meaningless!
You can just pick a single colour in the interface, and ignore the default colouring…
1 Like
That makes sense. Thanks a lot for your help! 
As this visualization is not very informative, I would like to create an overlay image with the count of seed points within each voxel to get a general idea of the seed point distribution, as suggested by @Daniel_Blezek. I could not find the right MRtrix3 tool for this, yet. Do you have any suggestions how this could be done? Alternatively, I thought of registering my seed point map to MNI-space to then overlay the AAL-atlas to count seed points within specific labels. For this, I used tcktransform with the same inverse DWI to MNI transformation matrix that I used to register my tractogram to MNI-space. However, I receive a similar error message tcktransform: [SYSTEM FATAL CODE: SIGSEGV (11)] Segmentation fault: Invalid memory access. Could this be the same issue as before?
Thank you.
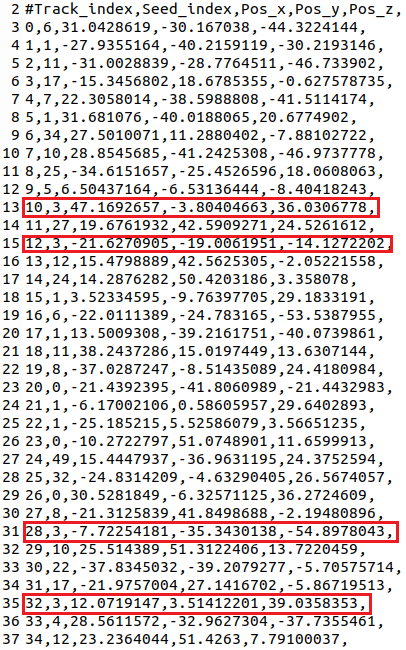
When having a closer look at the seeds_coord.txt file (before removing the trailing commas), I noticed that several fibers (e.g. line 13, line 15, line 31 and line 35 of attached screenshot) were seeded from the same seed point, thus they have the same seed index, but still the seed point coordinates are very different. I assumed that seed points with the same seed index are identical (several fibers tracked from the same seed point) and should have the same or only slightly varying coordinates?