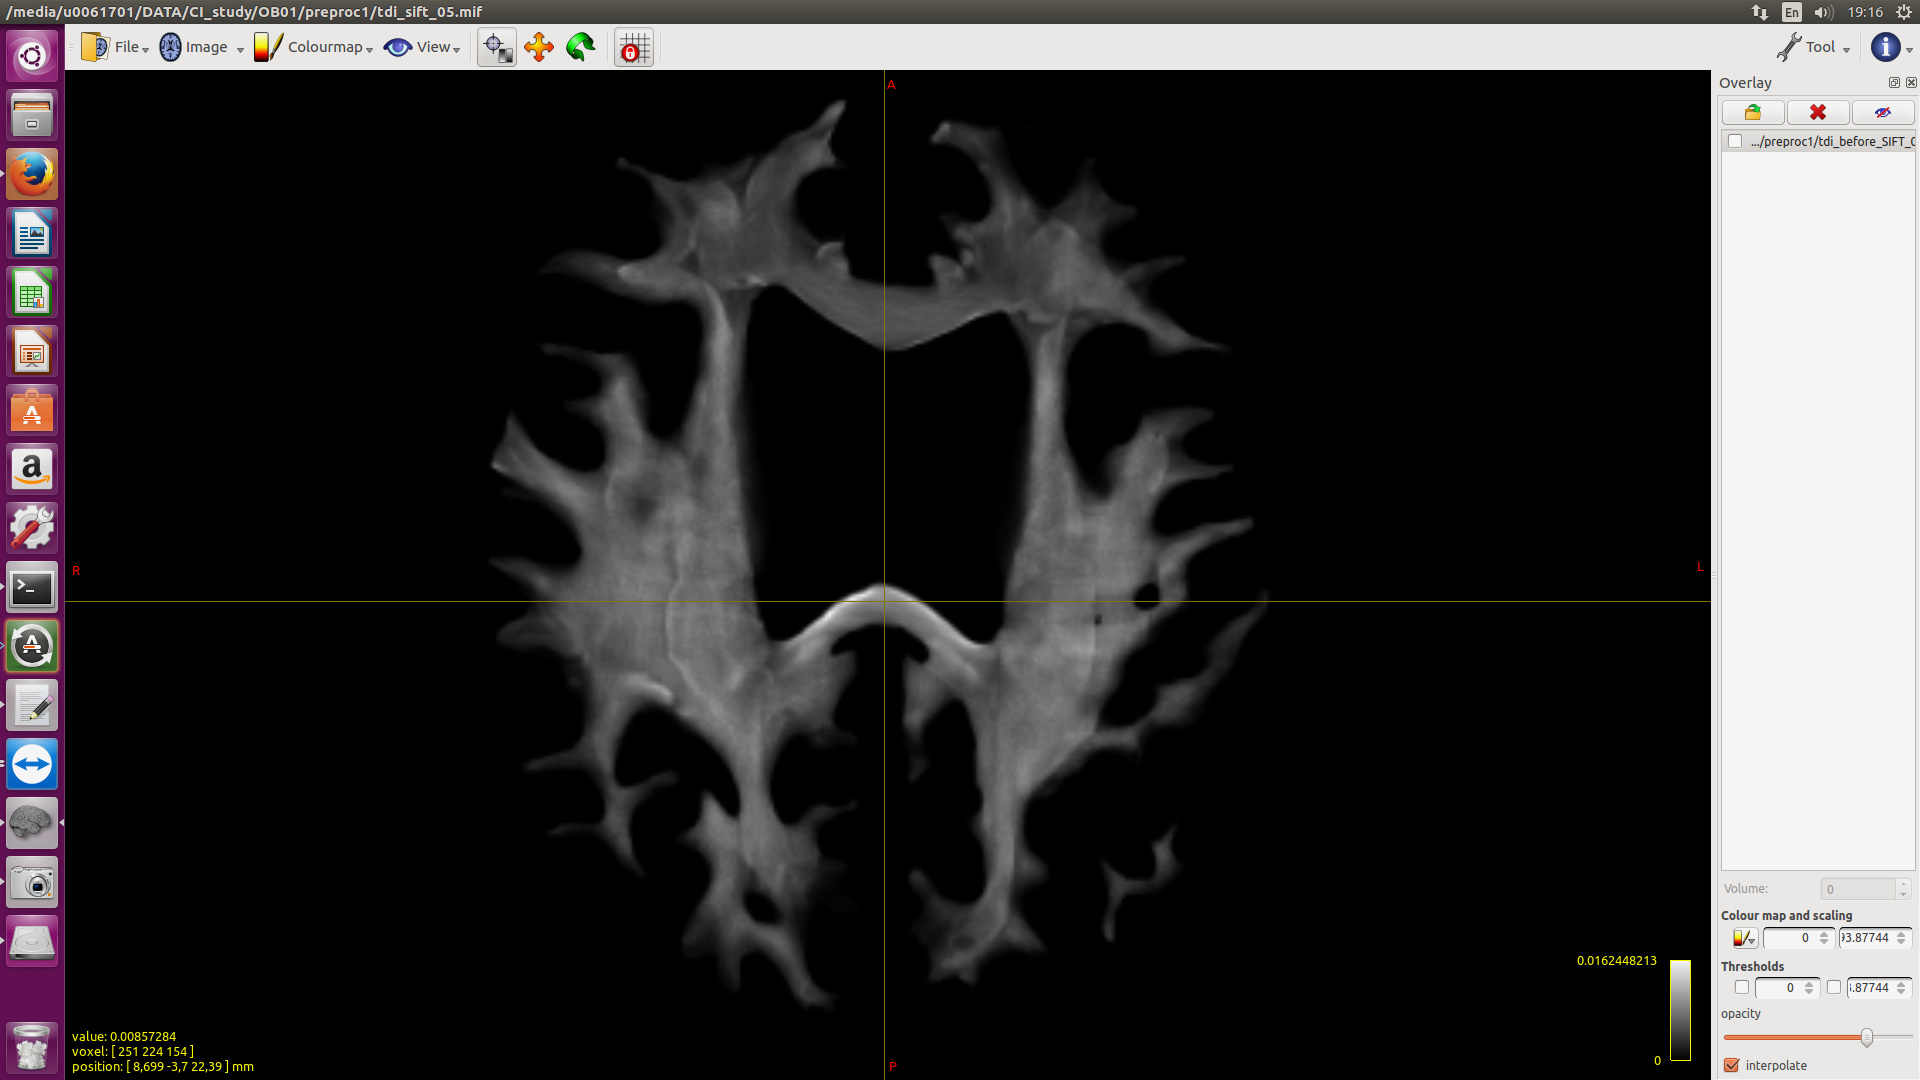
I would like to generate super resolution tdi with SIFT2 (like the ones in Fig10 SIFT2 paper) but I get very low image intensity range. I was wondering whether I used these commands properly. Importantly, was the mu used for that figure?
% Note: The intensity normalization across subjects and average response calculation were done in the pipeline.
For tdi after SIFT2:
tcksift2 tractogram20M.tck FOD_AVE_WM_inten.mif weights.csv -act 5TT.mif -out_mu mu.txt
% mu is in this case: 1.47345e-05
tckmap tractogram20M.tck -tck_weights_in weights.csv -template FOD_AVE_WM_inten.mif -precise -vox .5 - | mrcalc - 1.47345e-05 -mult tdi_SIFT2_05res.mif
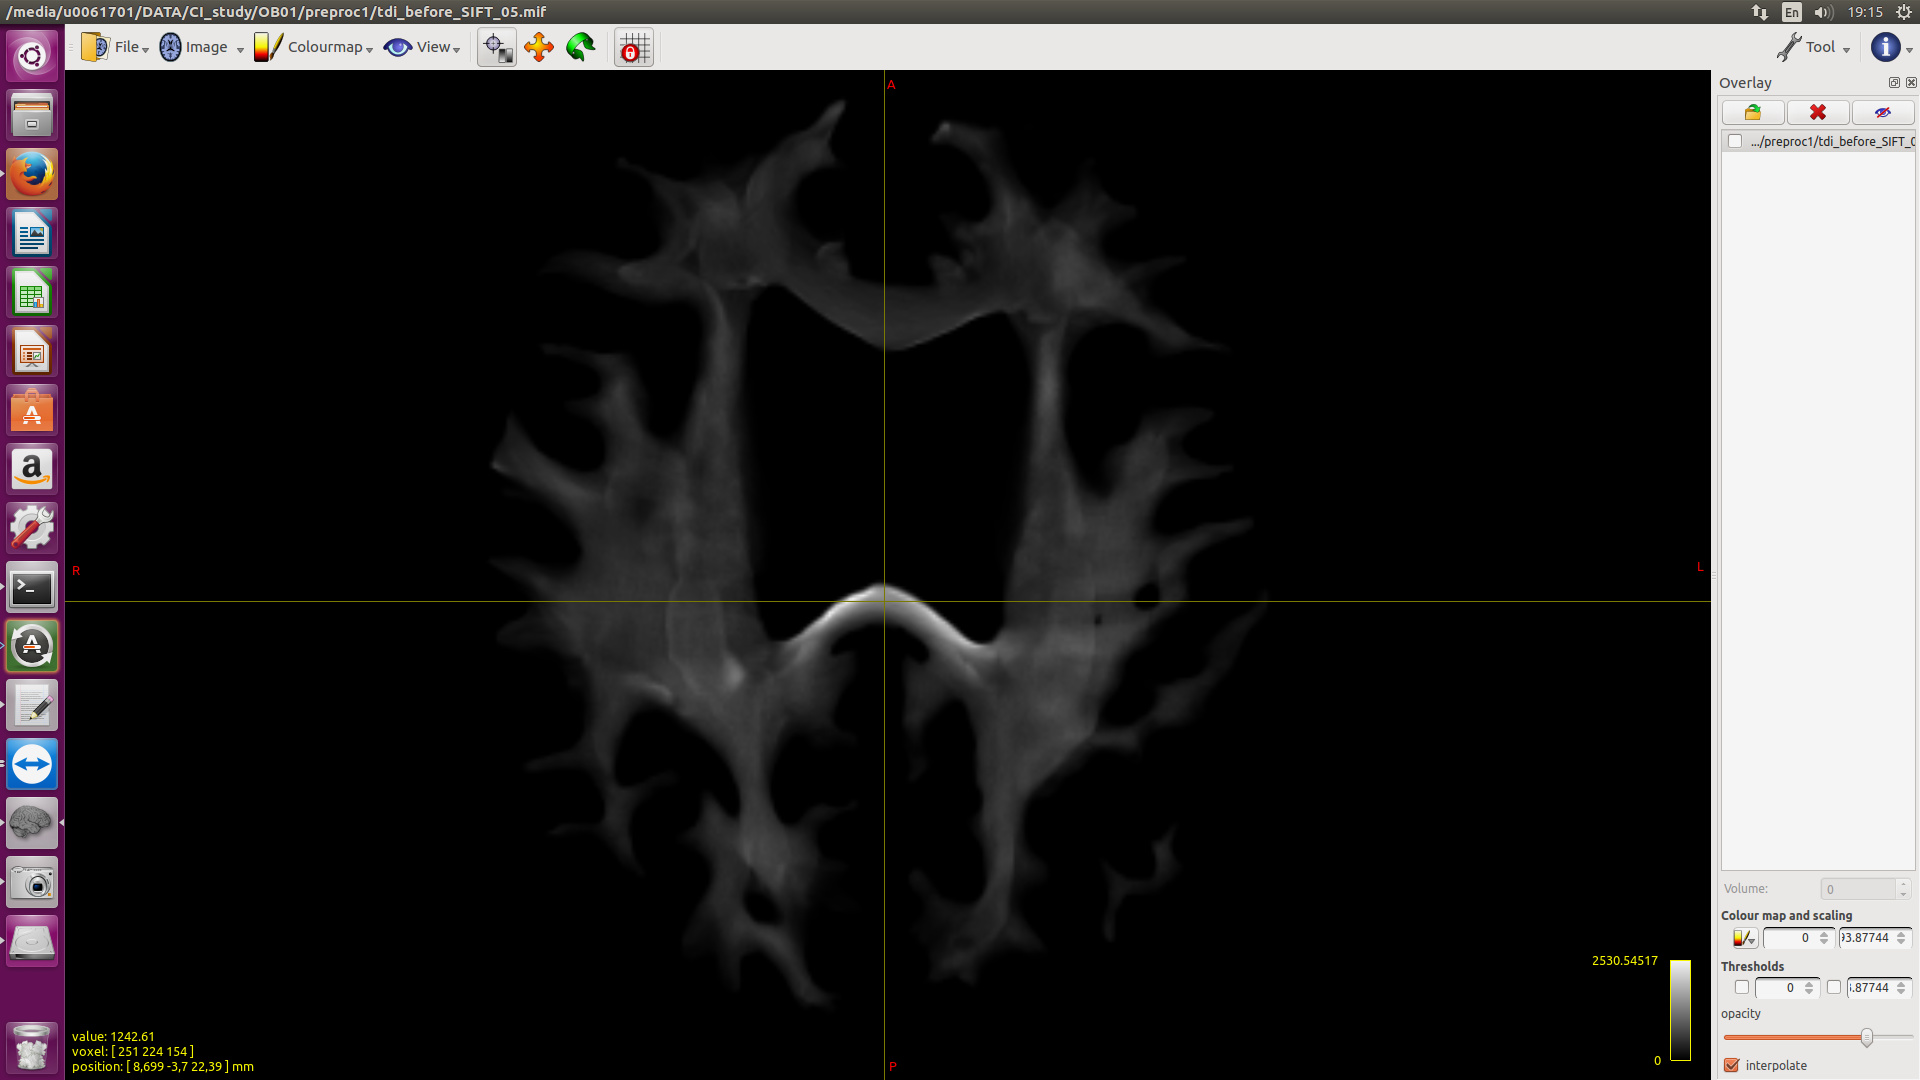
Given the TDI after SIFT2 has been multiplied by ~ 1e-5, whereas the raw TDI has not, and the intensity difference between the two images is ~ 0.01 v.s. ~ 1000 (or a factor of ~ 1e-5 difference), I’d say you’re probably fine
Looks like I didn’t multiply by mu in that particular figure. However note that the proportionality coefficient is in fact valid even if SIFT2 is not applied; it’s just calculated via equation 4. So there’s nothing stopping you from also multiplying the TDI in the absence of SIFT2 by mu, in which case the two images would be more comparable in intensity.
The proportionality coefficient is used partly so that the SIFT2 weights are approximately distributed around 1.0 (as opposed to the tractogram before SIFT2, where the track weights are all precisely 1.0). It’s for expediting comparison between streamlines densities and fibre density; not for comparing track density with SIFT2 to track density without SIFT2.
Probably the absolute value of mu depends on many factors during preprocessing but does ~1e-5 sound right to you?
As I read somewhere in the forum, I should include this factor in connectome reconstruction. How would that be done? Should I just multiply weights.csv file by mu and then feed it to tck2connectome?
I also wonder about the rationale of the targeted tractography. Why do we need that in addition to the whole brain tractography? I mean, can’t we just use the values between the 2 ROIs extracted from the whole brain tractography without performing the extra targeted tractography?
And what is the appropriate number of streamlines for the targeted tractography in relation to the whole brain one?
Probably the absolute value of mu depends on many factors during preprocessing but does ~1e-5 sound right to you?
Yes, this is a typical value. This parameter has units of AFD/mm. So if a single-fibre voxel has AFD ~ 1.0, and size 2mm, and ~ 5,000 streamlines going through it, then the streamlines density and fibre density would approximately match.
As I read somewhere in the forum, I should include this factor in connectome reconstruction. How would that be done?
I would expect that multiplying the resulting matrix by mu would be a faster solution than multiplying the whole weights file.
I also wonder about the rationale of the targeted tractography. Why do we need that in addition to the whole brain tractography? I mean, can’t we just use the values between the 2 ROIs extracted from the whole brain tractography without performing the extra targeted tractography?
Yes of course; this is how most such experiments would be performed. The combined targeted tracking / whole-brain tracking example is simply a proof of concept. The benefits are increased density of reconstruction of the pathway of interest leading to better delineation, and/or decreased density of reconstruction of the whole-brain tractogram leading to decreased execution time.
I would expect that multiplying the resulting matrix by mu would be a faster solution than multiplying the whole weights file.
Exactly! I had figured it out later. So, the between node values (for 162 freesurfer parcellation) became very small. The min, max and mean (probably these measures are too rough!) of these 162 values range between 0, 1.8+/- 0.3 and 0.019+/-0.002 across my young healthy population. Do these values also sound typical?
I also have a new question regarding the combined approach. How much should be approximately the ratio between the whole brain and targeted tractography if one opts for the combined approach (In my case, I have obtained 20M whole brain tractography and applied SIFT2 and aware of the fact that SIFT2 needs to be redone after concatenation! :-)).
I wouldn’t normally be looking so closely at these raw values, since they’re in relative units and only comparable within your cohort, and hence the absolute value is irrelevant.
How much should be approximately the ratio between the whole brain and targeted tractography if one opts for the combined approach
No idea. I only presented that approach as a proof-of-concept. If pursuing that path you would need to perform your own experimentation and apply your own heuristics to decide on numbers. Though if you’re happy generating 20M whole-brain in each subject, there’s probably no point in using this approach: I’d expect any vaguely reproducible pathway to have reasonable streamlines numbers if extracted from a 20M tractogram.