Hi Mrtrix Developers,
I have recently done FBA analysis and ran fixelcfestats on a group of 17 controls and 15 disease subjects. I dont know how to interpret the results of fixelcfestats. I followed the instructions given in mrtrix doc to visualize the p-values using tsf files. I am not sure about the threshold value to set for the p-value (min threshold value and max threshold value, is it 0 and 0.05 respectively). I have selected fwe pvalue.tsf as the ‘colour by (track) scalar file’ and the same as the ‘Separate Scalar file’ in the thresholds dropdown menu. The reason behind my doubt is I see p-values of zero everywhere throughout the whole brain tracks. I am unsure about selecting the significant fixels.
Please see the below screenshots ,
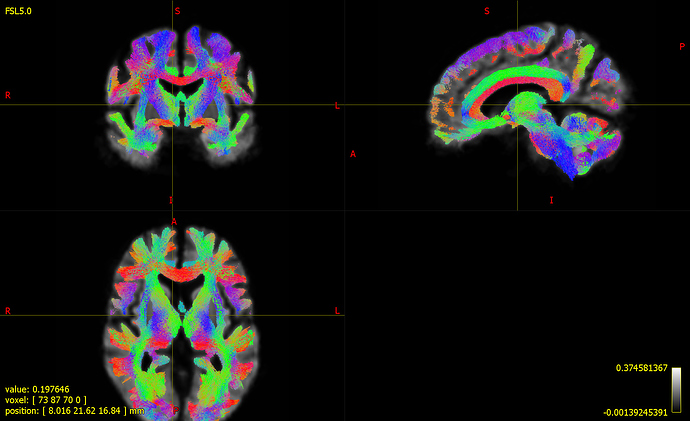
- whole brain tractogram 200000 tracks
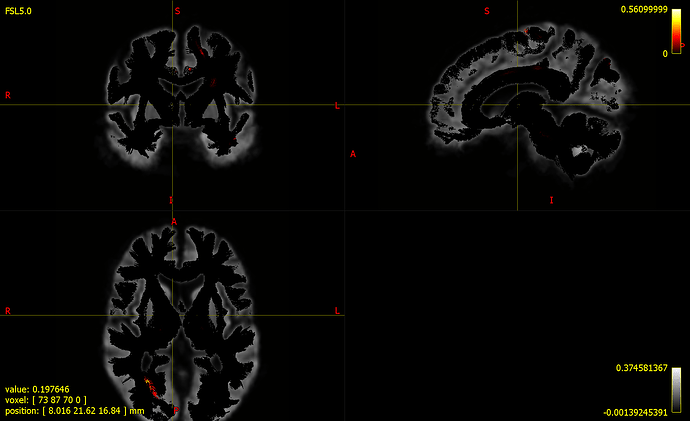
- fwe_pvalue.tsf as colour by (track) scalar file ( See all the fixels in black colour which denotes p-value of around 0), Is it something wrong with my visualization or with the GLM analysis?
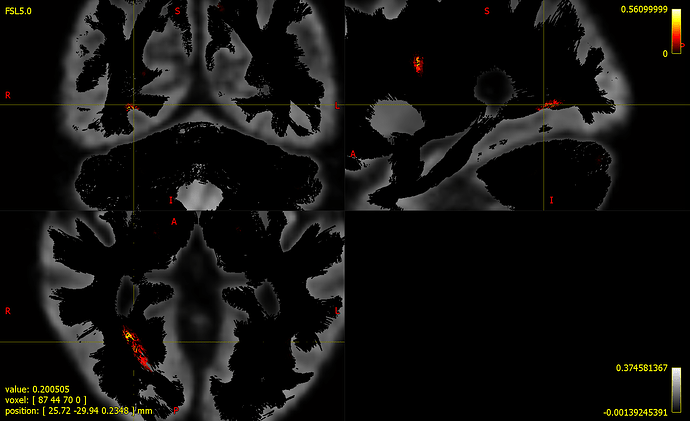
- Display zoomed in
Thanks for any suggestions.
Best,
Rajikha


