I’m looking for any advice, tips or tricks for visualizing large sets of mrtrix data.
We’re frequently working with sub 1mm isotropic data, which can produce huge files. I find myself trying to visualize tracts with file sizes ranging from 10 - 100GB. I’m relatively new to mrtrix, but am impressed with the possibilities. I’ve been a longtime user of fsl tools and dtk/trackvis and am used to being able to pull up full brain results and manipulate those interactively.
I have a cluster at my disposal with tons of RAM available, so generating large datasets is no problem.
I’ve tried tckresample to downsample some data, but am not 100% sure of the effect this has on the actual results. Downsampling a 100GB tck file to 25GB still results in a file that completely seizes my 32GB iMac.
OK, that is indeed huge… The problem here is that OpenGL will want these data on the GPU for rendering, and there are no GPUs that I know of equipped with that much RAM. Realistically, there’s no point trying to visualise streamlines files that exceed a GB: framerate will be poor, especially if the graphics card has less RAM than required to hold the data (since the driver will need to swap data on & off the card constantly). But more importantly, with that many tracks being displayed, you simply can’t see any detail. I find 100k - 200k streamlines to be about right to get a decent visualisation of the overall data (which shouldn’t take much more than ~100MB with standard settings). Any more than that and it becomes impossible to discern individual streamlines.
You could reduce the number of streamlines using tckedit -num (assuming the streamline order is random). Resampling will help to some extent, but that won’t give you the several orders of magnitude reduction in file size that you’re after here…
If you do want to display all of the streamlines, then I think you’d be better off generating a high-resolution track-density image (potentially colour-coded) and displaying that as a regular image.
This will of course, with the tckgen defaults, also result in a pretty small stepsize, and hence a tractogram that is potentially a factor larger in filesize. You may want to look at the -step option of tckgen and set it to something a little bit larger than what the default would come up with based on your spatial resolution. That, and in addition the tckedit -num step @jdtournier suggested. I fully agree with him that 100k~200k streamlines is more than enough to show all the detail you can realistically expect in a single whole-brain tractogram. Anything beyond that will simply not convey any extra information via a direct visualisation of the streamlines… even if your GPU could handle it.
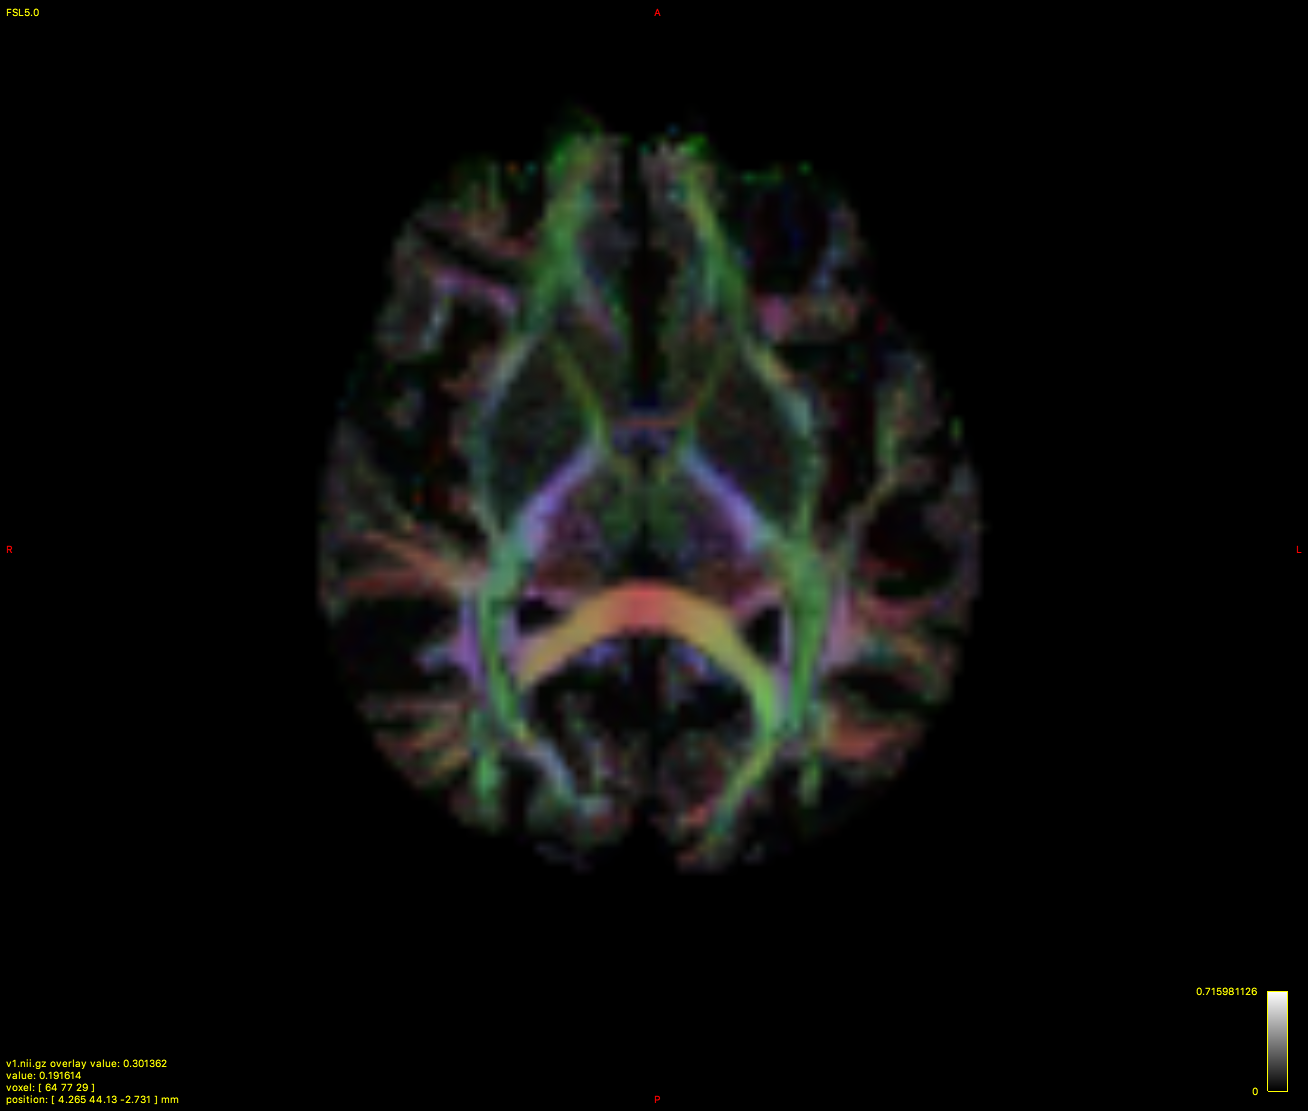
i made an RGB DEC image with fod2dec and a density image via afdconnectivity, but am unsure how to get the density image color coded ( other than putting the colorfa or dec image on top of it ). Here’s a 2mm example, the hires version is still running:
That 0.5mm is just an initial suggestion, you can push it higher if you want - just bear in mind that it will rapidly blow out your RAM… And given that you’ll probably want to display that in MRView at arbitrary angles, your GPU RAM will again be a bottleneck, since the entire image will be pushed onto the GPU as a 3D texture. But by all means give it a try, see how you go.