Hi everyone,
I would like to know if there has been any update on the possibility of tracing the ROIs (doing the manual segmentation) in a projection that is different than the one obtained with the scan.
We are working on a very small animal model, the brain is very small and it’s impossible to place it in a proper orientation for the MRI scan.
So when I do the manual segmentation the projection is not symmetrical and it’s very hard to track the border of structures and make sure the segmentation is symmetrical.
I really need a way to re-orient the projection and make it symmetrical during the actual segmentation.
I don’t know if I was clear in describing my problem.
Has this issue been addressed before? Is there anything that can be done?
Thanks a lot
Gabriella
The way to do this would be to regrid the image you want to trace on so that the anatomy of interest is aligned with the image axes, and then use that as your basis when creating your ROI and drawing it. You can theoretically do this using mrtransform, but it’s far from trivial unfortunately.
The best thing here would be to produce a tool in mrview that allows the user to save an image as reoriented in the viewer – but this would require quite a bit of time to get right, and is unfortunately a fair way down our list of priorities right now… This isn’t the first time it’s been requested though, so if there’s a lot of demand for it, we may decide to prioritise doing something like that…
Hi, thank you for your reply.
Is there any guideline on how to use Mrtransform for such a task?
I have also tried to use another software, 3D slicer, to transform the .nii MRI file and place it in a correct orientation then save it and open it as a transformed .nii file in Mrview. But MRView still opens it in an asymmetrical orientation…it’s really frustrating…i would really appreciate some help or guidelines to do this. I have to do manual segmentation on y samples and doing it in the wrong orientation is close to impossible.
Thanks a lot!
Gabriella
I’m afraid not – like I said, it’s not a trivial process to do manually. I’ll try to give you a flavour of what’s involved below, which will hopefully at least explain why, and then I’ll try to give you a way forward.
It sounds to me like you’re modifying the transformation information in the header without regridding (?). This won’t help – and most likely won’t help with any other tool to draw ROIs. Have you tried using something like ITKsnap or any other software to draw your ROIs, by the way? There’s no reason ROIs drawn outside of mrview can’t be used with MRtrix3.
What I mean by modifying the transformation information is that you can specify in the header the real world orientations of the x, y, z axes of your image – which effectively re-orients the data with respect to real space – but crucially this doesn’t affect the relationship between the information in your images and the voxel grid that it lies on. To allow drawing ROIs in a sane manner, we really need the drawing to be done on a slice that aligns with the axes of the ROI image that you’re editing, otherwise you’re trying to draw a 2D shape that has to be re-gridded across a 3D volume in a non-trivial way, and that is a badly-defined operation (believe me, we’ve tried to find ways to support that…). If you believe the images produced by your other software packages have genuinely been regridded, not just re-oriented, then there’s something very odd going on, let us know and we’ll investigate.
Now onto how to get around this: the way mrtransform works for regridding is that you need to provide a template image, which specifies the grid that you want your images mapped onto. The tricky thing for you here is to generate a template image whose axes are aligned with the relevant anatomical features of your data. There is simply no easy way to produce this directly from the viewer – and ideally that’s what you want to be able to do.
The information that you need to be able to regrid properly consists of at least:
- the orientation of the x, y, z axes of your intended image in real space;
- the location of the origin of your image (the position of the x=0, y=0, z=0 voxel);
- the voxel dimensions along each of the x, y, z axes;
- the number of voxels along each of the x, y, z axes (alternatively, the field of view in millimeters).
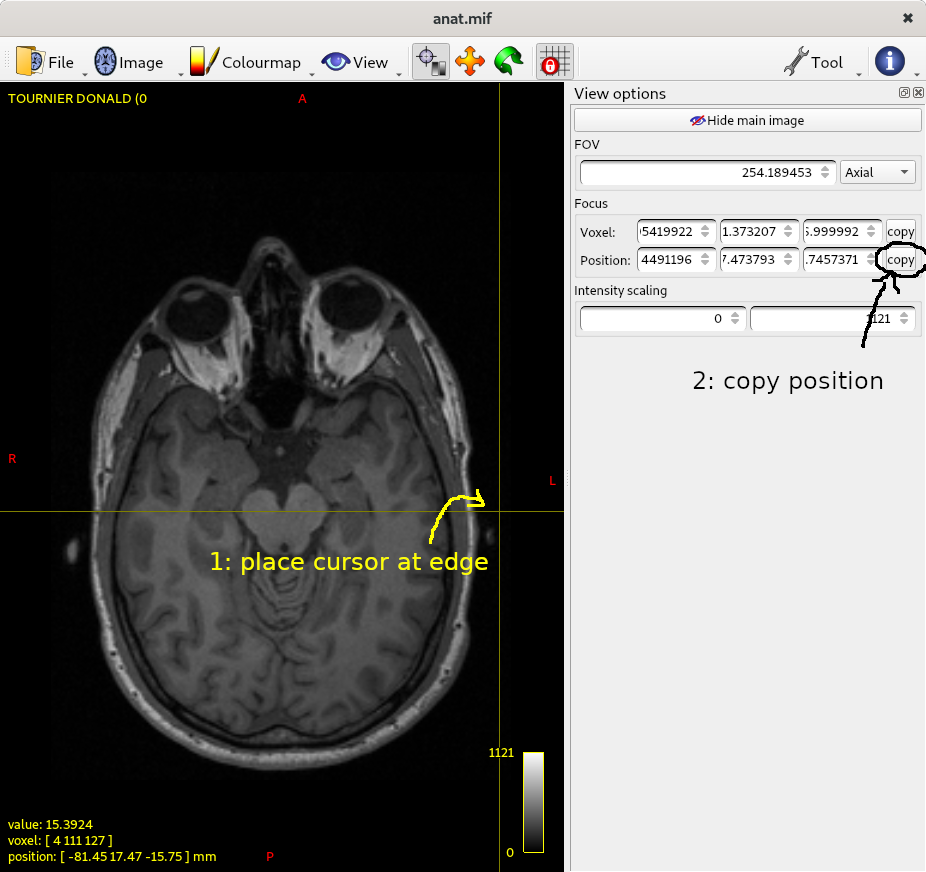
You can get all the information you need to compute the right parameters from mrview, but it’s not all that trivial. The simplest way I can think of to do that currently involves noting down the real space coordinates of two points at opposite ends of the field of view along each axis (see diagram below). From those 6 sets of coordinates (2 for each of the 3 axes), you can work out all the relevant information using a bit of linear algebra. Rather than take you through all the maths, here’s a script (at the end of this post) that you can simply copy/paste into a new file, named gen_header.py (or whatever you feel is appropriate), which you can then invoke with:
python gen_header.py 0.8 template.mih
where the first argument (0.8) is the voxel size of the target grid, and the second (template.mih) is the name of the output header file (it needs to be in .mih format, since it’ll be a pure header with no actual data). Note that you’ll need numpy for this to work. The script will ask you to enter the coordinates for each set of points in the right order. You can get these by getting the image aligned in the viewer as you want it, then place the crosshairs somewhere along where you’ll want the left edge of the image to be, copy the position (from the View tool), paste it into the terminal and press enter.
Do the same for the opposite edge:
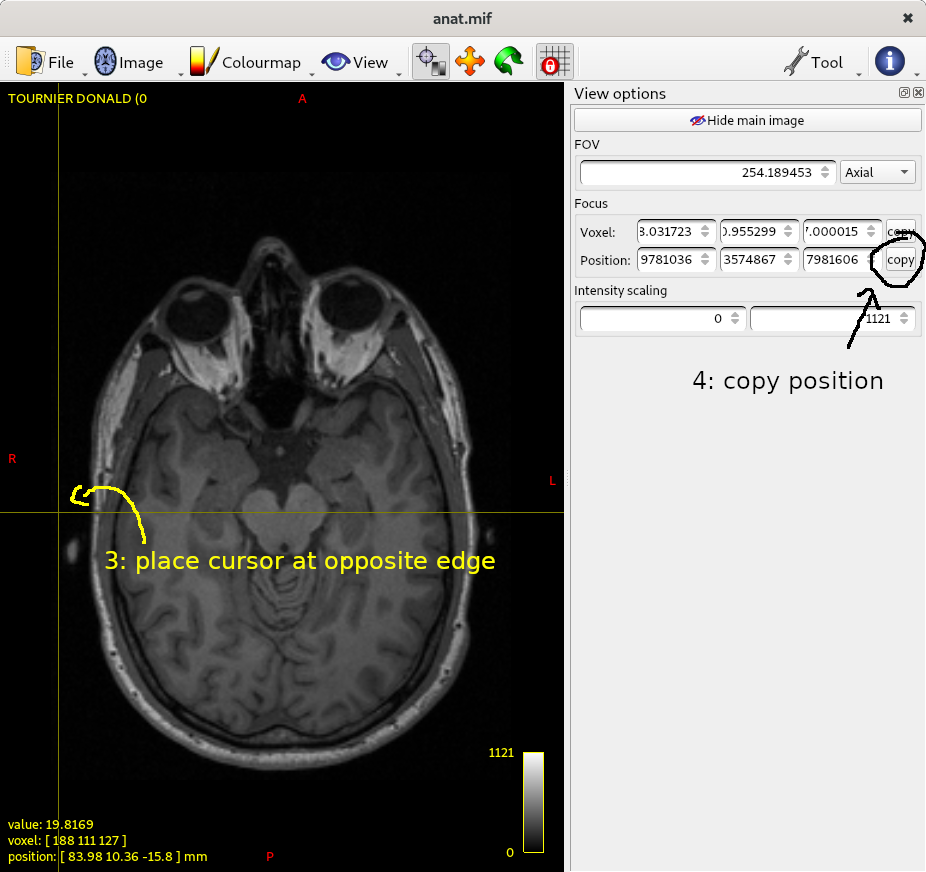
… and repeat for all 6 points requested. You should end up with a terminal output that looks a bit like this:
enter real-world coordinates of point on left edge of image: -83.4184418, 10.4577713, 15.2899847
enter real-world coordinates of point on right edge of image: 84.0232162, 2.58272743, 18.2334671
enter real-world coordinates of point on posterior edge of image: -0.729082763, -88.9634171, -21.8012428
enter real-world coordinates of point on anterior edge of image: 4.27144051, 101.865776, 55.3763351
enter real-world coordinates of point on inferior edge of image: 3.329144, 27.1571312, -53.6692276
enter real-world coordinates of point on superior edge of image: -1.55378473, -26.7377529, 79.9075775
This will then generate a simple text file (called template.mih in the example above), which you can then pass to mrtransform using the -template option, e.g.:
mrtransform original.mif -template template.mih regridded.mif
This seems to work OK on my system, hopefully you’ll find it useful too.
Python script: gen_header.py:
#!/usr/bin/env python

import numpy as np
import sys

if len (sys.argv) is not 3:
  print ('usage: gen_header.py voxelsize outputheader.mih      (with voxelsize in millimeters)')
  sys.exit (1)

vox = float(sys.argv[1])

# get vertices of edges from user:
x1 = np.array ([ float(x.strip(',')) for x in input("enter real-world coordinates of point on left edge of image: ").split() ])
x2 = np.array ([ float(x.strip(',')) for x in input("enter real-world coordinates of point on right edge of image: ").split() ])
y1 = np.array ([ float(x.strip(',')) for x in input("enter real-world coordinates of point on posterior edge of image: ").split() ])
y2 = np.array ([ float(x.strip(',')) for x in input("enter real-world coordinates of point on anterior edge of image: ").split() ])
z1 = np.array ([ float(x.strip(',')) for x in input("enter real-world coordinates of point on inferior edge of image: ").split() ])
z2 = np.array ([ float(x.strip(',')) for x in input("enter real-world coordinates of point on superior edge of image: ").split() ])

# unit vector for each axis:
x = (x2-x1)/np.linalg.norm(x2-x1)
y = (y2-y1)/np.linalg.norm(y2-y1)
z = (z2-z1)/np.linalg.norm(z2-z1)

# find closest orthonormal matrix:
M = np.vstack ((x,y,z)).transpose()
u, s, v = np.linalg.svd (M)
M = np.dot (u,v);

# work out origin:
origin = np.array ([ x.dot(x1), y.dot(y1), z.dot(z1) ])
origin = M.dot (origin)

M = np.hstack (( M, np.array([origin]).transpose()))
dim = [ int(round(np.linalg.norm(x1-x2)/vox)), int(round(np.linalg.norm(y1-y2)/vox)), int(round(np.linalg.norm(z1-z2)/vox)) ]

# header contents:

header = '''mrtrix image
dim: ''' + ','.join([str(x) for x in dim]) + '''
vox: ''' + ','.join([str(x) for x in [vox]*3 ]) + '''
layout: +0,+1,+2
datatype: UInt16LE
transform: ''' + ','.join([ str(x) for x in M[0,:] ]) + '''
transform: ''' + ','.join([ str(x) for x in M[1,:] ]) + '''
transform: ''' + ','.join([ str(x) for x in M[2,:] ]) + '''
file: nonexistent.dat
'''

# write to file:
with open (sys.argv[2], 'wb') as fd:
  fd.write (header.encode('utf-8'))
Hi and thank you so much for your reply and for the patience in providing all the details of the procedure. I will try soon and I hope it will help.
The image should maintain the same resolution after this process?
Thanks a lot again
Gabriella