Hi Simona,
so the paper you attached here from Zhu et al. is about having some seeds, performing whole-brain seed-based tractography from those seeds, getting fibre distribution maps as an output for each subject and each seed, coregister all the outputs together and get two outputs:
- Using “segmentation” by overlap with JHU atlas regions you can get streamline count for each white matter tract using different seeds.
- You get averaged fibre distribution map.
You have mentioned, your goal is to get streamlines crossing specific ROIs, that suggests tractography.
So, in general, you can analyze DWI data in a 2 different ways:
- voxel-level (and fixel-level) modeling and subsequent analyses give you some value for each element in a volume and you compare them (e.g. DTI model and fractional anisotropy in each voxel as a parameter)
- tractography approach (first step is always voxel-level modeling) gives you streamlines in your volume, those are usually not evaluated for each voxel but rather in a bigger scale, e.g. some anatomical structures or specific ROIs.
So, speaking of a template:
The link you have attached from MRtrix3 is about the first approach - calculating parameter per each fixel and comparing those parameters. I don’t know how familiar you are with fixels but they are pretty cool and you can learn more about them here. For two different subjects measured by same sequence, they can look like this:

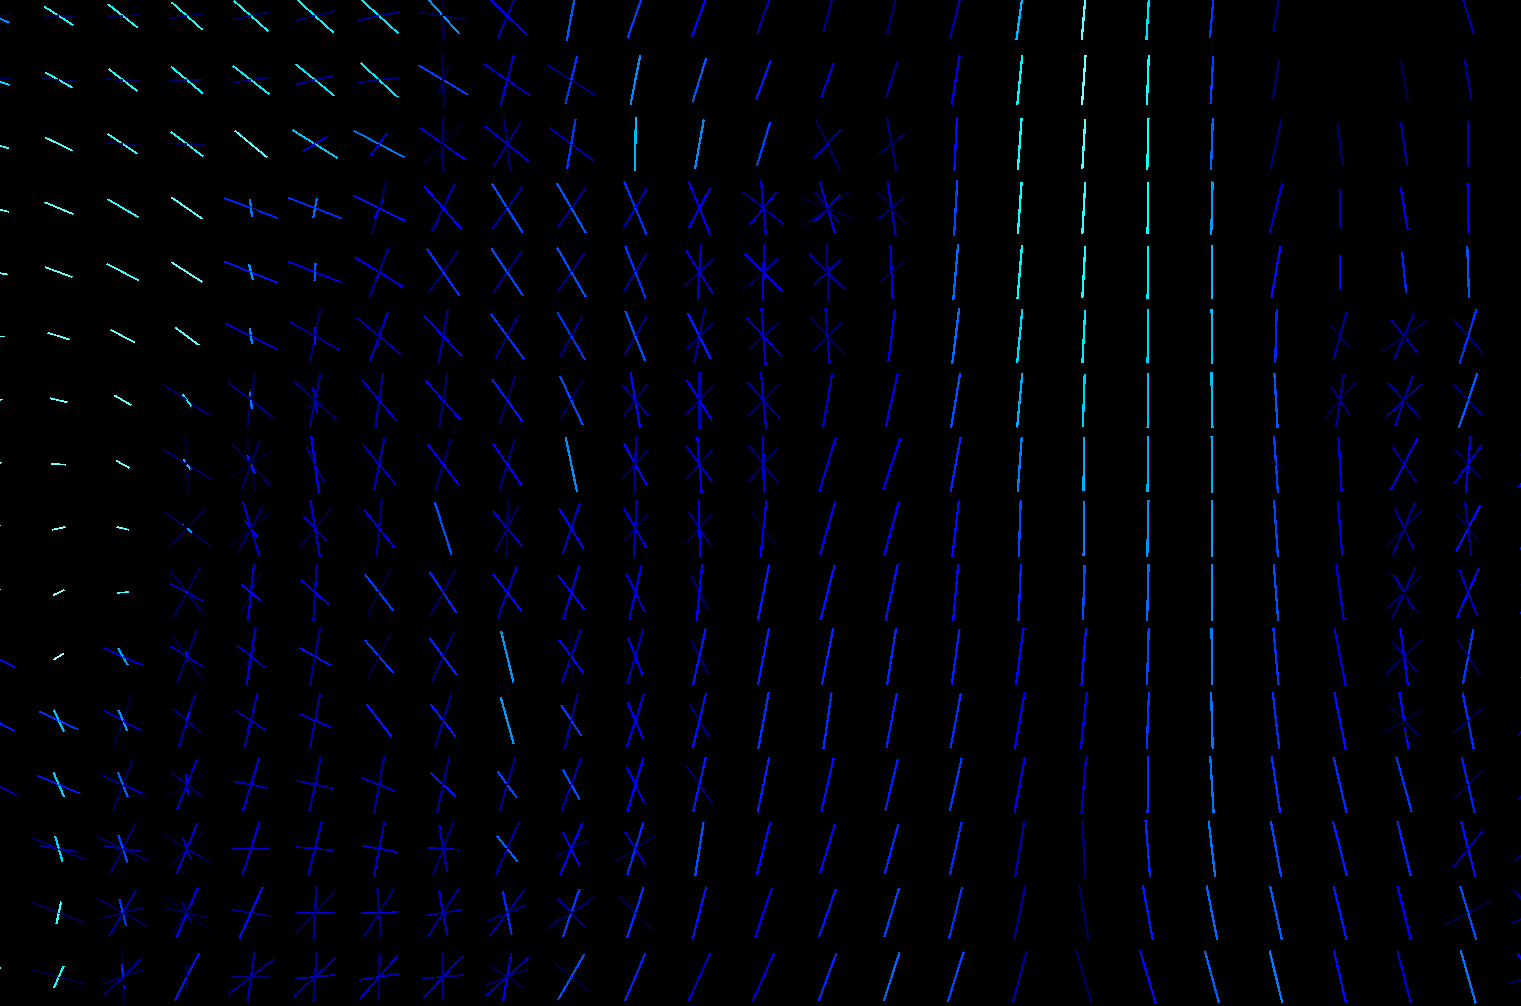

One subject is hot color-scheme, Second one is cool, the third image is overlap.
You can see that in some voxels you have only one stick (a.k.a. fixel), somewhere multiple of them and they are rotated differently. If you calculate fixels on 10 subjects, you will get 10 different images. That is a problem cause here you don’t get 1 parameter per 1 voxel, but 1 parameter per 1 fixel ![]() And if you have different amount of fixels and they are rotated differently for each subject, nonlinear transformation of all of your voxels into MNI152 standard will not solve that those parameters are non comparable.That is why we have template. It is our standard space, a scheme. It could be build from all of your subjects but it is not a necessity. Subjects FODs are repeatedly nonlinearly registered to the previous group mean sufficient convergence of the group mean. Then, we can register FODs from all our subjects to the subject-specific template and use a one and only common space with one common distribution of fixels. So we are able to statistically compare different subjects by comparing parameters of those cute little elements called fixels and we are sure we are comparing same fixels in the same voxels between all subjects. That means, template is primarily our standard space for fixel-based analysis, not a one picture that can replace one of your study groups.
And if you have different amount of fixels and they are rotated differently for each subject, nonlinear transformation of all of your voxels into MNI152 standard will not solve that those parameters are non comparable.That is why we have template. It is our standard space, a scheme. It could be build from all of your subjects but it is not a necessity. Subjects FODs are repeatedly nonlinearly registered to the previous group mean sufficient convergence of the group mean. Then, we can register FODs from all our subjects to the subject-specific template and use a one and only common space with one common distribution of fixels. So we are able to statistically compare different subjects by comparing parameters of those cute little elements called fixels and we are sure we are comparing same fixels in the same voxels between all subjects. That means, template is primarily our standard space for fixel-based analysis, not a one picture that can replace one of your study groups.
To the actual template creation:
Just a little note but it is a general rule to use both groups to build a template (to reflect FOD distribution in your study) unless there are some unusual circumstances such as huge structural abnormalities in your patient group or something similar that would shift template estimation enormously.
Also, be always careful to compare two datasets that were acquired differently and on a different machines using different sequences, since part of the effect you see, could be potentialy a reflection of this difference as well. So make sure you regress it in your GLM.
All that being said, and sorry for a long answer, what you have attached as a second approach is linked to the one kind of an approach for processing of your data you can use in MRtrix3, called Fixel-based analysis. In this case we use study-specific template. You can definitely go this way by providing whole FBA analysis available on a link you have attached, including whole-brain tractogram generation. Then you can use tckedit to select tracts based on inclusion/exclusion criteria using either binary masks or spehere around some coordinates. Then, you can use this edited tractograms, convert them to fixels using tck2fixel and use them as a mask for any calculation between your subjects you wish using your FD, FC and FDC parameters from Fixel-based analysis. If you would like to do any tract segmentation as mentioned in an attached paper, you can always coregister and convert any atlas from e.g. FSL or elsewhere into fixels using voxel2fixel command. Moreover, you can use pretty easy and quick segmentation of this template whole-brain tractogram via tractseg to get even fancier masks of tracts - you can find more information here. You have many options here to look at this, you can for example calculate the weighted mean of FD/FC/FDC for each segmented tract and compare this means from both groups between subjects for each tract…
Speaking of a tractography:
One general rule is that it is always better to be in a subject space as long as possible and avoid any unnecessary registration steps. Ideally, do it as a last step in your analysis. Using only one tractogram per HCP group provided by template and compare your patients to this, sounds like you can lose a distribution (of for example streamlines count per seed) within HCP group by using only one representant. I would suggest that the best tractography approach would be, for each one of your patient and HCP group, combo of commands: tckgen, tcksif2 and tck2connectome, where your nodes will be your ROIs. Read more about it here. Than you can then play with it as you want.
E.g.you can use tckstats to calculate statistics on streamline lengths, connectomestats if you will use connectome-like approach… etc.