Troubles with tractography on 7T diffusion data

Unsing python 3.7 to run this script produces this error:
python plotdir.py

Traceback (most recent call last):
  File "/home/rosella/anaconda3/lib/python3.7/site-packages/matplotlib/projections/__init__.py", line 58, in get_projection_class
    return projection_registry.get_projection_class(projection)
  File "/home/rosella/anaconda3/lib/python3.7/site-packages/matplotlib/projections/__init__.py", line 25, in get_projection_class
    return self._all_projection_types[name]
KeyError: '3d'

During handling of the above exception, another exception occurred:

Traceback (most recent call last):
  File "plotdir.py", line 20, in <module>
    ax = fig.add_subplot(111, projection='3d')
  File "/home/rosella/anaconda3/lib/python3.7/site-packages/matplotlib/figure.py", line 1396, in add_subplot
    self._process_projection_requirements(*args, **kwargs)
  File "/home/rosella/anaconda3/lib/python3.7/site-packages/matplotlib/figure.py", line 1120, in _process_projection_requirements
    projection_class = projections.get_projection_class(projection)
  File "/home/rosella/anaconda3/lib/python3.7/site-packages/matplotlib/projections/__init__.py", line 60, in get_projection_class
    raise ValueError("Unknown projection %r" % projection)
ValueError: Unknown projection '3d'
(base) [rosella@carmela spine]$
(base) [rosella@carmela spine]$ ValueError: Unknown projection '3d'

Adding the line: from mpl_toolkits.mplot3d import Axes3D
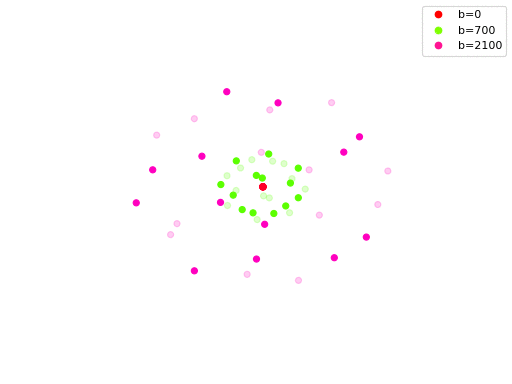
solved but I had to remove ax.set_box_aspect([1,1,1]) as it raised an error. The figure I get is:


Now I am just wandering why it just plots directions for 2 different b values and not for all three I have in my dw_scheme,
Thanks ,
Rosella
ps. please find attached also the dw_scheme:

0.270606 -0.726231 0.631951 0
-0.998162 -0.014610 -0.058809 700
0.999166 0.012921 -0.038726 2100
-0.252566 0.822345 0.509862 700
-0.095579 0.812031 -0.575734 2100
-0.305237 -0.618753 0.723861 700
0.286285 -0.531493 -0.797218 2100
0.731183 0.589477 -0.343349 0.01
-0.276116 -0.485740 -0.829347 700
-0.490041 -0.871550 0.016155 2100
-0.317022 0.828773 -0.461121 700
-0.378766 -0.051377 -0.924065 2100
-0.738067 -0.215575 -0.639363 0.01
0.804609 -0.227822 -0.548363 700
-0.754112 0.645481 0.121118 2100
0.689122 0.631217 0.355915 700
-0.175440 -0.277778 0.944489 2100
0.025185 0.934397 0.355342 0.01
0.767429 -0.150706 0.623170 700
0.285904 0.731388 0.619137 2100
-0.196443 -0.980503 0.004841 700
0.698076 -0.454196 0.553530 2100
0.259468 -0.121245 -0.958111 0.01
-0.328684 0.134420 0.934825 700
0.667622 0.541908 -0.510506 2100
0.730042 -0.683291 -0.012326 700
0.199927 -0.974623 -0.100694 2100
-0.882861 0.436847 0.172396 0.01
0.781145 0.525345 -0.337380 700
-0.821612 -0.342579 -0.455623 2100
-0.230434 0.255813 -0.938861 700
-0.744261 0.119551 0.657102 2100

In the standard MRtrix format, as described in the docs.

The version of Python isn’t the problem here, it’s the version of the matplotlib Python package that needs to be at least 3.3, as @maxpietsch pointed out. Updating it will depend on your system, but can typically be done using pip.

That’s simply because the colourmap used to pick colours for the different shells (hsv) is cyclic: it’s the same colour for b=0 and b=bmax. So that red dot in the middle is actually at b=0, as you should be able to verify by rotating the display. You can pick a different, non-cyclic colourmap if you want, just change line 4 to list one of the available choices.

1 Like

Hi
I just have an ultimate question about this 3d spherical representation of acquisition scheme. What does opacity specifically represent?
thank you
rosella

The points shown as transparent correspond to the opposite direction of one of the opaque dots. Only the opaque directions are actually listed in the encoding scheme, and are in fact acquired. But since diffusion is symmetric, there should be no difference in terms of diffusion signal between images with diffusion weighting along some direction g or its opposite -g. But it does impact on other things like eddy-current induced distortions. So this allows you to see how well the shell is sampled in terms of the diffusion signal (all dots) or in terms of its resilience to eddy-currents (opaque dots only).

1 Like

By “opaque” you mean the most marked dots wrt. the transparent ones?

Yes, by opaque, I mean the non-transparent dots.

1 Like

Just one more question, if I had to insert axes in this figure, which ones should I use (labels)?
Would they be x, y and z directions in q-space? Which units of measure, though?
rgb_cube
thank you
Rosella

Hi Rosella,

Yes, the axes would effectively be in 3D q-space, though more precisely in the b-space. And as coded, the units of measure are in b – same as the values provided in the DW encoding table.

Hope this helps,
Donald.

1 Like

Thank you.
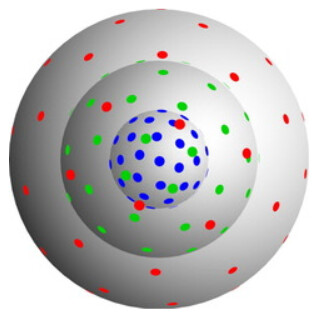
One precisation . If I wanted to represent the spherical surface of each shell like in this image
image
how should I modify the code you suggested and I used to generate my image?
image
thanks a lot,
Rosella