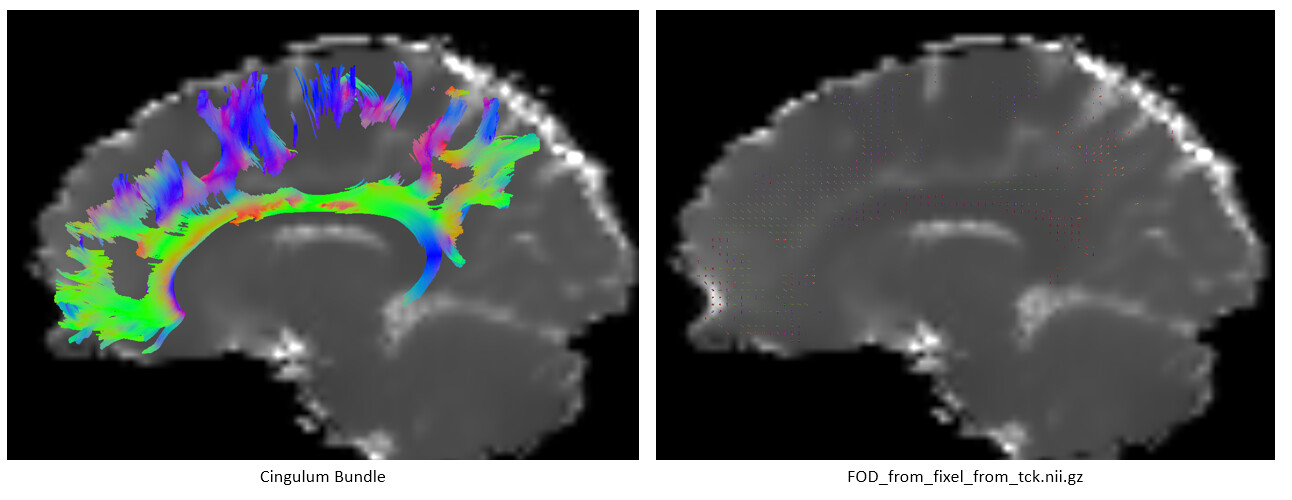
From a fiber bundle (the cingulum), I would like to extract the FOD lobes that contributed to the construction of this bundle from the original FOD used to build the bundle. In order to do this, I used the following commands :
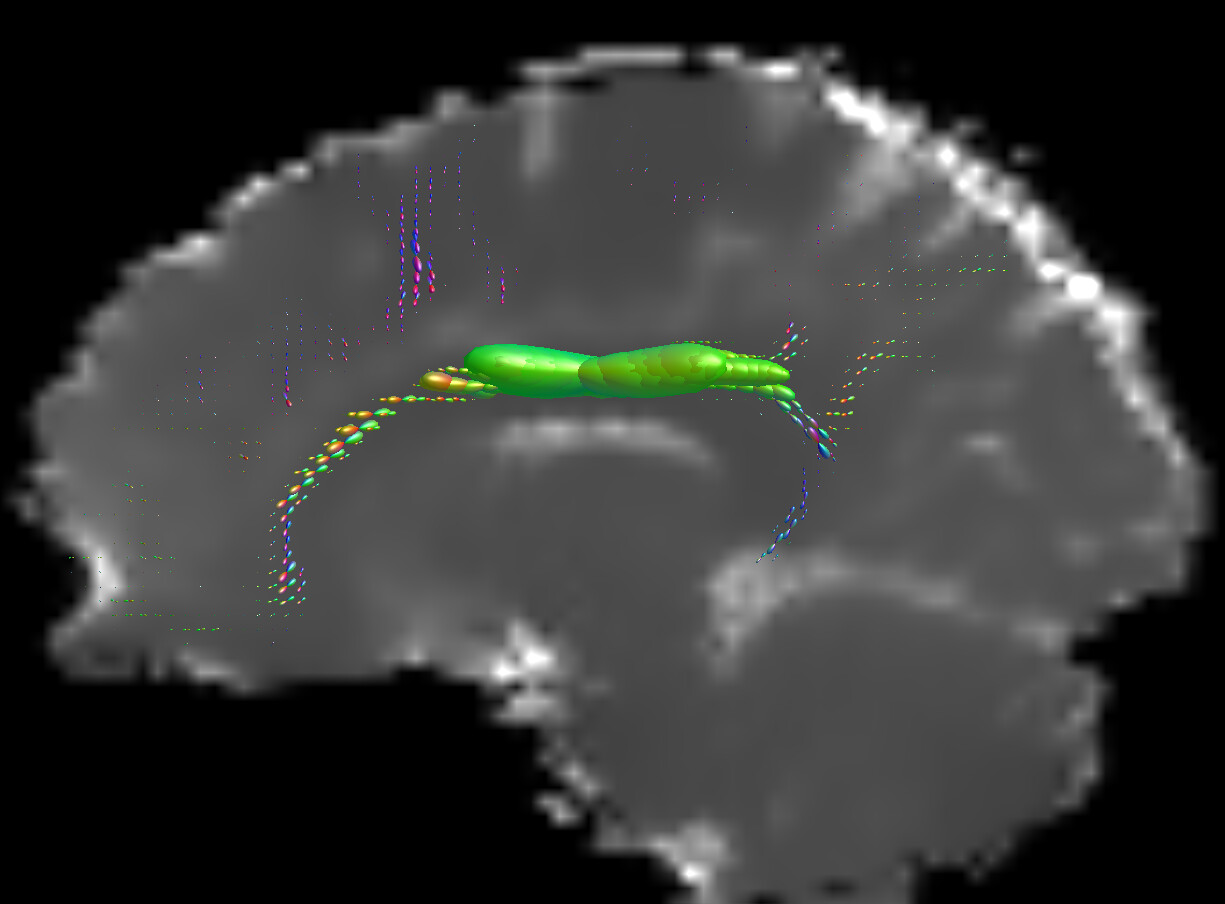
When visualizing FOD_from_fixel_from_tck.nii.gz, I have something quite suprising with very small FOD lobes where the bundle seems to be the most dense.
The issue you’re highlighting here is precisely what SIFT / SIFT2 were designed to address: using standard streamlines-based tractography approaches, there is no simple relationship between streamlines density and ‘apparent’ fibre density (e.g. as observed from the FOD). I recommend you have a look through the relevant papers (particularly the original SIFT paper) to understand why that is. The fact that you’re representing these as fixels is broadly unrelated to that.
More recently, @rsmith wrote a whole paper on the topic, which is currently available as a pre-print. I recommend you have a look in there for more detailed look into the issues.
In your fixel2sh call, you’re providing file fixel_from_tck/directions.mif as input. What ends up happening here is that this is interpreted as a fixel data file that is to be used to determine the SH amplitudes. So for each fixel, the corresponding magnitude in the output SH image will be proportional to the X-component of the direction of that fixel, since the command will only read from the first “column” of the directions file when interpreted as a fixel data file.
If you instead provide file fixel_from_tck/fixel_from_tck.nii.gz as input (which is a bit of a misnomer: the fixels don’t “come from” the tracks; rather, the output data file contains the track count per fixel), you should get the kind of result you were expecting, similar (but not identical) to what was obtained using tckmap -tod.