Hi all,
I am struggeling with how to use the information the SIFT2 weights give me in my analysis.
I’ll first quickly describe my question & pipeline:
Q:
Is there a difference for DTI/NODDI metrics between two groups in a tract of interest (TOI)?
Pipeline:
On DWI image:
- preproc
- CSD, FOD, ACT
- whole brain tractography:
tckgen -act “$file” -backtrack -seed_gmwmi “$seed” -minlength 5 -maxlength 250 -cutoff 0.06 -angle 45 -select 25000000 “$wmfod” “$tracks” - SIFT2:
tcksift2 -act “$file” -out_mu “$mu” -out_coeffs “$coeffs” -fd_thresh 0.02 “$tracks” “$wmfod” “$weights” -nthreads 2
On T1w image:
5. recon-all for segmentation
6. create masks for 2 regions of interest (ROI’s), merge them so that ROI 1 has value 1 and ROI 2 has value 2.
7. coregister masks to DWI space
DWI space:
8. use tck2connectome to assign nodes to ROI’s
tck2connectome “$tracks” “$mergedmask” “$connectome” -out_assignments “$assignments” -tck_weights_in “$weights” -symmetric
9. use connectome2tck to get TOI
connectome2tck “$tracks” “$assignments” “$TOI” -nodes 1,2 -exclusive -files single -tck_weights_in “$weights” -prefix_tck_weights_out “$weightsTOI”
10. filter streamlines using tckedit by lenght (max_length = mean length + 1,5 * standard deviation):
tckedit “$TOI” “$filtered_TOI” -tck_weights_in “$sift2weights” -tck_weights_out “$filtered_sift2weights” -maxlength “$max_length”
I ran NODDI and DTI models on my TOI and aim to use Bayesian multilevel model (brms)
Now I used the SIFT2 weights in 2 ways:
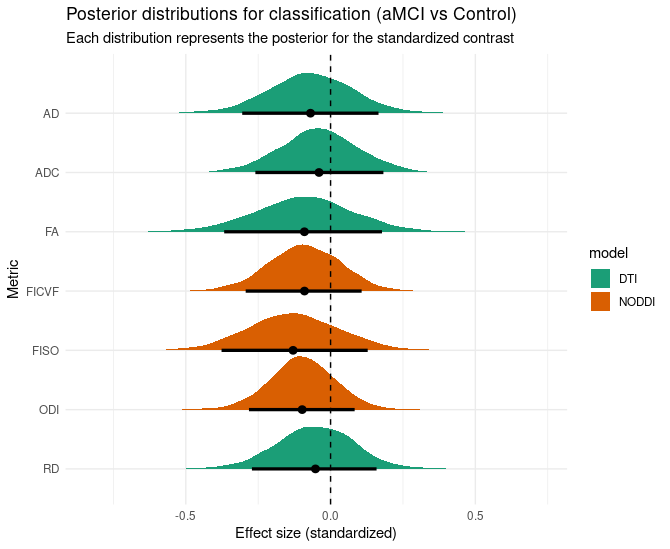
- compute a weighted average per TOI, where I first sum all metric outcomes of the voxels of the streamline, devide by the amount of voxels. Then multiply the streamline with its weight (sift2), sum these for all streamlines in the TOI, and devide by the total weight of the TOI.
When I used that in a simplistic model:
bfa_fa ← bf(FAa_z ~ classification + age_z + (1 | participant_id))
.
.
.
.
maverage_dti ← brm( bfa_fa + bfa_adc + bfa_rd + bfa_ad + set_rescor(FALSE))
The contrast per group of the posterior distributions are like this:
where everything right of the 0 line means that most likely the metrics values of aMCI group are higher than control.
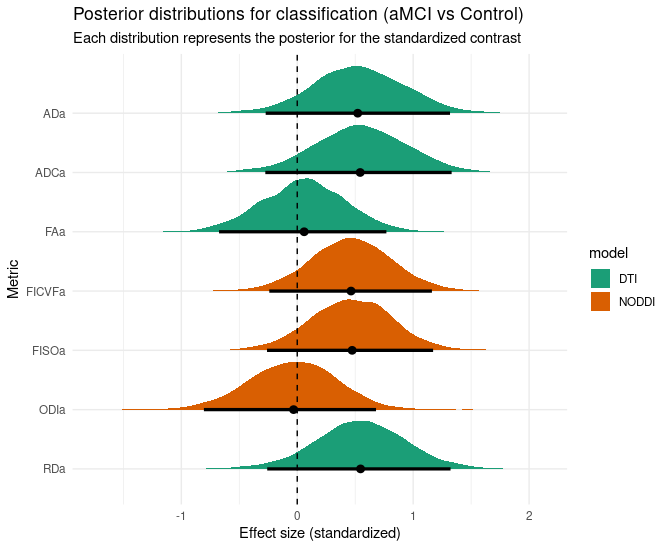
- Use as much information as possible for my model (what Bayes analysis prefers). Dont average, but include a metric for every streamline and the corresponding streamlines SIFT2 weight. I use the SIFT2weight as a likelihood in the model.
like this:
bf(FA_z | weights(sift2_weight) ~ classification + age_z + (1 | participant_id)),
.
.
.
mfull_dti ← brm( bfa_fa + bfa_adc + bfa_rd + bfa_ad + set_rescor(FALSE))
the contrast posterior distribution outcome shifts towards the other side:
! I will post this as a comment because I can only include 1 image !
A long introduction to my actual question:
brms uses the log likelihood of the SIFT2 weight, but can I use it like that?
Intuitively, both methods should give about the same outcome, but they dont.
Or would I have to manipulate the SIFT2 weight first to use it in statistical analysis like this.
The main complication is that I want to use the SIFT2 information, because it gives me extra evidence for biological plausibility, I am just a bin unsure what the best way to use it is.
Could somebody help me with this?
Best,
Merel